Here is a bivariate data set. x y 63 50 66 57 67 48 59 55...
Here is a bivariate data set.
| x | y |
|---|---|
| 63 | 50 |
| 66 | 57 |
| 67 | 48 |
| 59 | 55 |
| 68 | 44 |
| 68 | 40 |
| 62 | 37 |
| 45 | 70 |
Find the correlation coefficient and report it accurate to four
decimal places.
r =
Homework Answers
Here we have data:
| X | Y |
| 63 | 50 |
| 66 | 57 |
| 67 | 48 |
| 59 | 55 |
| 68 | 44 |
| 68 | 40 |
| 62 | 37 |
| 45 | 70 |
Here we are use Excel for calculation:
Scatter plot:
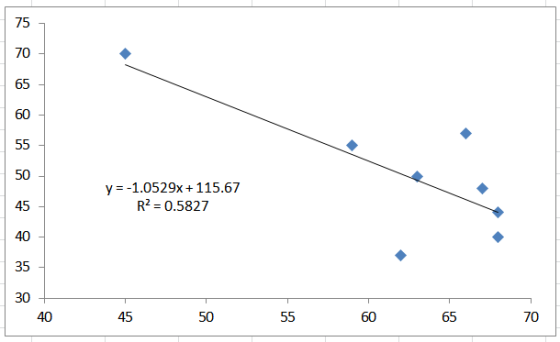
We get:
R^2 = 0.5827
Correlation cofficient:
r = SQRT(0.5827)
= 0.7633
Correlation coefficient r = 0.7633 (Round to four decimal place)
Here is a bivariate data set. x y 17 118 35 167 67 48 26 146...
Here is a bivariate data set. x y 17 118 35 167 67 48 26 146 48 6 61 97 48 -117 53 -3 31 115 31 29 Find the correlation coefficient and report it accurate to four decimal places. r =
Here is a bivariate data set. х у 68 78 37 64 60 44 -20 97...
 Here is a bivariate data set. х у 68 78 37 64 60 44 -20 97 48 6 33 56 73 57 50 44 51 46 62 103 Find the correlation coefficient and report it accurate to four decimal places. Hint: Textbook Pages Help Get Help: Points possible: 1 This is attempt 1 of 3.
Here is a bivariate data set. х 94 94 81 67 у 98 -7 21 69...
 Here is a bivariate data set. х 94 94 81 67 у 98 -7 21 69 85 84 70 46 68 55 89 22 -65 10 -31 215 Find the correlation coefficient and report it accurate to four decimal places. r= Check Answer
Linear Regression bivariate data set
 Here is a bivariate data set.x y78 3066 2547 -964 7466 3854 -1539 -1059 2262 4754 26Find the correlation coefficient and report it accurate to four decimal places. r=
Problem 4: Variables that may affect Grades The data set contains a random sample of STAT 250 Final Exam Scores out of 80 points. For each individual sampled, the time (in hours per week) that the stu...
Problem 4: Variables that may affect Grades The data set contains a random sample of STAT 250 Final Exam Scores out of 80 points. For each individual sampled, the time (in hours per week) that the student spent participating in a GMU club or sport and working for pay outside of GMU was recorded. Values of 0 indicate the students either does not participate in a club or sport or does not work a job for pay. The goal of...
estimate the average age at which multiple sclerosis patients were diagnosed with the condition for the...
estimate the average age at which multiple sclerosis patients were diagnosed with the condition for the first time in a given city. How big should the sample be? Define your procedures for this estimate (if necessary, set your own values of unknown parameters, based on statistical theory). In Table 1 you will find all ages of this patient population. 54 58 56 48 62 59 55 56 60 52 53 61 56 56 53 37 71 62 39 61 54...
Here is a bivariate data set. у 43 51 34 40 21 34 43 68 22...
 Here is a bivariate data set. у 43 51 34 40 21 34 43 68 22 29 57 60 3965 52 50 Find the correlation coefficient and report it accurate to four decimal places.
Problem 1: Confidence Interval for Percentage of B’s. The data set “STAT 250 Final Exam Scores”...
Problem 1: Confidence Interval for Percentage of B’s. The data set “STAT 250 Final Exam Scores” contains a random sample of 269 STAT 250 students’ final exam scores (maximum of 80) collected over the past two years. Answer the following questions using this data set. a) What proportion of students in our sample earned B’s on the final exam? A letter grade of B is obtained with a score of between 64 and 71 inclusive. Hint: You can do this...
Consider the below matrixA, which you can copy and paste directly into Matlab.
Problem #1: Consider the below matrix A, which you can copy and paste directly into Matlab. The matrix contains 3 columns. The first column consists of Test #1 marks, the second column is Test # 2 marks, and the third column is final exam marks for a large linear algebra course. Each row represents a particular student.A = [36 45 75 81 59 73 77 73 73 65 72 78 65 55 83 73 57 78 84 31 60 83...
Here is a bivariate data set. x y 56.5 70 63.2 34.5 75.3 20.2 69.4 22...
Here is a bivariate data set. x y 56.5 70 63.2 34.5 75.3 20.2 69.4 22 33.7 141 44.5 112.3 52.2 81.6 58.6 58.2 58.2 57.6 66.9 40.6 68.8 37.5 Find the correlation coefficient and report it accurate to three decimal places. r = What proportion of the variation in y can be explained by the variation in the values of x? Report answer as a percentage accurate to one decimal place. r² = %
 Here is a bivariate data set. х у 68 78 37 64 60 44 -20 97 48 6 33 56 73 57 50 44 51 46 62 103 Find the correlation coefficient and report it accurate to four decimal places. Hint: Textbook Pages Help Get Help: Points possible: 1 This is attempt 1 of 3.
 Here is a bivariate data set. х 94 94 81 67 у 98 -7 21 69 85 84 70 46 68 55 89 22 -65 10 -31 215 Find the correlation coefficient and report it accurate to four decimal places. r= Check Answer
 Here is a bivariate data set. у 43 51 34 40 21 34 43 68 22 29 57 60 3965 52 50 Find the correlation coefficient and report it accurate to four decimal places.
Most questions answered within 3 hours.
-
Where is the error in this code sequence?
String s1 = "Hello";
String s2 = "ello";...
asked 10 months ago -
Financial data for Joel de Paris, Inc., for last year
follow:
Joel de Paris, Inc.
Balance...
asked 10 months ago -
Consider this reaction:
Al2(SO4)3 (aq)+ BaCl3
(aq) Al2Cl6 (aq)- +
3BaSO4(s) . What is the...
asked 10 months ago -
Suppose that Savneet is considering increasing her
recent random sample from 20 car rentals to 40...
asked 10 months ago -
Trucks arrive at an unloading terminal at an average rate of 120
per hour.
Trucks arrive...
asked 10 months ago -
Why are methanol and ethanol completely soluble in water while
octanol is not very little soluble....
asked 10 months ago -
A facilities manager at a university reads in a research report
that the mean amount of...
asked 10 months ago -
When the CuSO4 is rehydrated by adding water to the anhydrous
compound, is this an endothermic...
asked 10 months ago -
A ray of sunlight is passing from diamond into crown glass; the
angle of incidence is...
asked 10 months ago -
A block of mass 0.249 kg is placed on top of a light, vertical
spring of...
asked 10 months ago -
how do the kidneys compensate in the presences of acidosis
a) trigger hyperventilate
b) reserve acid...
asked 10 months ago -
Question 501 pts
The rental rate of capital to the firm increases. Which of the
following...
asked 10 months ago