A professor records the number of students who complain each week throughout the semester. If the...
A professor records the number of students who complain each week throughout the semester. If the class size is forty students, what are 3-sigma control limits for this class? Construct a control chart and interpret the data. ( p chart).
|
Week # |
1 |
2 |
3 |
4 |
5 |
6 |
7 |
8 |
9 |
10 |
11 |
12 |
13 |
14 |
15 |
|
Complaints |
5 |
2 |
7 |
1 |
3 |
2 |
8 |
1 |
3 |
5 |
4 |
6 |
3 |
1 |
4 |
Homework Answers
Z = 3
SAMPLES = 40
SAMPLE TIME = 15
P = NO. OF DEFECTS / (SAMPLE * TIMES TAKEN) = 55 / (40 * 15) =
0.0917
STANDARD DEVIATION = SQRT((P * (1 - P)) / SAMPLES = SQRT((0.0917 *
(1 - 0.0917)) / 40 = 0.0456
UCL = P + (Z * STANDARD DEVIATION) = 0.0917 + (3 * 0.0456) =
0.2285
LCL = P - (Z * STANDARD DEVIATION) = 0.0917 - (3 * 0.0456) =
-0.0451, LCL < 0, THEREFORE, LCL = 0
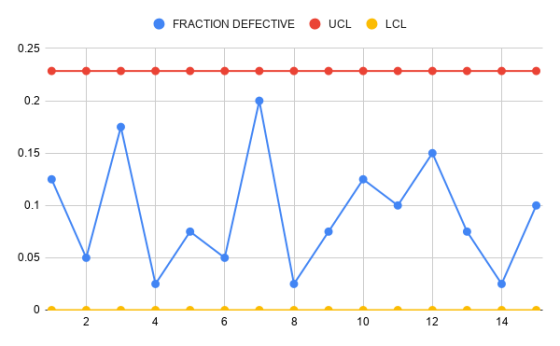
BASED ON THE CONTROL CHART, ALL THE OBSERVATIONS ARE UNDER CONTROL
Leave a like for the answer if you found it helpful.
Add Answer to:
A professor records the number of students who complain each
week throughout the semester. If the...
Problem #2 The registrar of a New England College receives a certain number of complaints each...
Problem #2 The registrar of a New England College receives a certain number of complaints each week about student registrations. Determine three sigma control limits using the following data. Present your control chart and briefly discuss if the process is in control: Week 1 2 3 4 5 6 7 8 9 10 11 12 13 14 # of Complaints 5 11 17 8 6 8 11 14 4 5 10 5 9 7
can you please answer all question Attribute Control Charts Q1. The results of an inspection of...
 can
you please answer all question
Attribute Control Charts Q1. The results of an inspection of DNA samples taken over the past 10 days are given below. Sample size is 100. Day 1 2 3 4 5 6 7 8 9 Defectives 7 6 6 9 5 6 0 8 9 10 1 a) Construct a 3-sigma p-chart using this information. What are the 3 sigma control limits? b) Using the control chart in part (a), and finding that the...
can
you please answer all question
Attribute Control Charts Q1. The results of an inspection of DNA samples taken over the past 10 days are given below. Sample size is 100. Day 1 2 3 4 5 6 7 8 9 Defectives 7 6 6 9 5 6 0 8 9 10 1 a) Construct a 3-sigma p-chart using this information. What are the 3 sigma control limits? b) Using the control chart in part (a), and finding that the...
2. The postmaster of a small western city receives a certain number of complaints each day about mail delivery. Construct a control chart with three sigma limits using the following data. Is the process in control? SAMPLE 1 2 3 4 5 6 7 8 9 10 11 12 13
1. The postmaster of a small western city receives a certain number of complaints each dayabout mail delivery. Construct a control chart with three sigma limits using the following data. Is the process in control? SAMPLE1234567891011121314Number of complaints4101489651213764210
A particular professor has noticed that the number of people, y, who complain about his attitude...
 A particular professor has noticed that the number of people, y, who complain about his attitude is dependent on the number of cups of coffee, x, he drinks. From eight days of tracking he compiled the following data: People (y) 12 11 10 6 5 6 4 4 Cups of coffee (x) 1 2 3 4 4 5 5 1 Unless otherwise stated, you can round values to two decimal places. a) Using regression to find a linear equation for...
1) Triangle Packaging Machinery wants to test the quality of its cereal bag filling machines. The...
1) Triangle Packaging Machinery wants to test the quality of its cereal bag filling machines. The firm’s quality analyst took 35 samples of size 7 each from a cereal-bag-filling machine. The results were overall mean = 57.75 pounds; average range = 1.78 pounds. a) Determine the upper and lower control limits of the x-chart, where sigma = 3 b) Determine the upper and lower control limits of the R-chart, where sigma = 3 2) The results of an inspection of...
In a Business Statistics class with 136 students, the professor records how much money each student...
 In a Business Statistics class with 136 students, the professor records how much money each student has in their possession during the first class of the semester. The histogram below is of the data collected. 60 50 40 30 20 10 0 10 20 30 40 50 60 Amount of Money 100 Reference: Ref 1-2 The number of students with over $30.00 in their possession is: under 5. about 10. about 30. O over 50.
Suppose students are given 5 assignments throughout the course of a semester. The number of assignments...
Suppose students are given 5 assignments throughout the course of a semester. The number of assignments turned in on time, out of those 5 total, can be seen below. The instructor would like to know whether the likelihood of turning in any assignment on time is equivalent for all students, and independent for each assignment. 0 1 2 3 4 5 3 2 11 15 22 20 i. Provide a null hypothesized distribution for this data situation. ii. Construct a...
A professor hypothesizes that students who earn a C or better in her class spend more...
A professor hypothesizes that students who earn a C or better in her class spend more time outside of class studying than students who receive a D or F. She collects the following data from two samples of students. What does she conclude? Number of hours studying per week for C or better students: 8, 4, 4, 2, 1, 5, 3, 2, 3 Number of hours studying per week for D or F students: 6, 2, 1, 0, 3, 2,...
A professor had students keep track of their social interactions for a week. The number of...
A professor had students keep track of their social interactions for a week. The number of social interactions over the week is shown in the following grouped frequency distribution. What is the class width? Number of Social InteractionsFrequencies5-10611-161817-221023-281329-341635-40941-46547-52653-58059-644
 can
you please answer all question
Attribute Control Charts Q1. The results of an inspection of DNA samples taken over the past 10 days are given below. Sample size is 100. Day 1 2 3 4 5 6 7 8 9 Defectives 7 6 6 9 5 6 0 8 9 10 1 a) Construct a 3-sigma p-chart using this information. What are the 3 sigma control limits? b) Using the control chart in part (a), and finding that the...
can
you please answer all question
Attribute Control Charts Q1. The results of an inspection of DNA samples taken over the past 10 days are given below. Sample size is 100. Day 1 2 3 4 5 6 7 8 9 Defectives 7 6 6 9 5 6 0 8 9 10 1 a) Construct a 3-sigma p-chart using this information. What are the 3 sigma control limits? b) Using the control chart in part (a), and finding that the...
 A particular professor has noticed that the number of people, y, who complain about his attitude is dependent on the number of cups of coffee, x, he drinks. From eight days of tracking he compiled the following data: People (y) 12 11 10 6 5 6 4 4 Cups of coffee (x) 1 2 3 4 4 5 5 1 Unless otherwise stated, you can round values to two decimal places. a) Using regression to find a linear equation for...
 In a Business Statistics class with 136 students, the professor records how much money each student has in their possession during the first class of the semester. The histogram below is of the data collected. 60 50 40 30 20 10 0 10 20 30 40 50 60 Amount of Money 100 Reference: Ref 1-2 The number of students with over $30.00 in their possession is: under 5. about 10. about 30. O over 50.
Most questions answered within 3 hours.
-
Where is the error in this code sequence?
String s1 = "Hello";
String s2 = "ello";...
asked 11 months ago -
Financial data for Joel de Paris, Inc., for last year
follow:
Joel de Paris, Inc.
Balance...
asked 11 months ago -
Consider this reaction:
Al2(SO4)3 (aq)+ BaCl3
(aq) Al2Cl6 (aq)- +
3BaSO4(s) . What is the...
asked 11 months ago -
Suppose that Savneet is considering increasing her
recent random sample from 20 car rentals to 40...
asked 11 months ago -
Trucks arrive at an unloading terminal at an average rate of 120
per hour.
Trucks arrive...
asked 11 months ago -
Why are methanol and ethanol completely soluble in water while
octanol is not very little soluble....
asked 11 months ago -
A facilities manager at a university reads in a research report
that the mean amount of...
asked 11 months ago -
When the CuSO4 is rehydrated by adding water to the anhydrous
compound, is this an endothermic...
asked 11 months ago -
A ray of sunlight is passing from diamond into crown glass; the
angle of incidence is...
asked 11 months ago -
A block of mass 0.249 kg is placed on top of a light, vertical
spring of...
asked 11 months ago -
how do the kidneys compensate in the presences of acidosis
a) trigger hyperventilate
b) reserve acid...
asked 11 months ago -
Question 501 pts
The rental rate of capital to the firm increases. Which of the
following...
asked 11 months ago