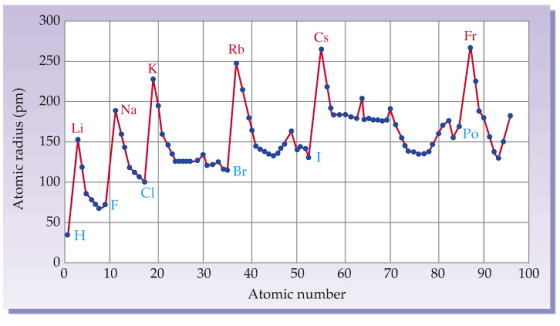
Construct a line graph that plots Atomic Radius (Y-axis) vs, Atomic Number (X-axis).
Construct a line graph that plots Atomic Radius (Y-axis) vs, Atomic Number (X-axis).
Homework Answers

I will suggest you to make this on graph paper.
And more accurate graph will be:
Add Answer to:
Construct a line graph that plots Atomic Radius (Y-axis) vs,
Atomic Number (X-axis).
A student plots the percent of sucrose in a beverage (x-axis) vs. the density (g/mL) (y-axis)....
 A student plots the percent of sucrose in a beverage (x-axis) vs. the density (g/mL) (y-axis). The resulting trendline has the given equation: y = 0.501x + 0.975 Calculate the percent of sucrose in a beverage with a density of 1.125 g/mL. Select one: O 30% O 20% O 40% O 100%
Question 3 (1 point) A student plots a graph of absorbance on the y axis and...
 Question 3 (1 point) A student plots a graph of absorbance on the y axis and concentration on the x axis, generating a regression line of y = 2795x -0.0125. What is the concentration of the absorbing species in solution, if the percent transmittance is 42.8? 1.36x10⁻⁴M 1.27x10⁻⁴ M 8.404x10⁻⁴ M 1.55x10⁻⁴ M.
Draw an XY graph that compares the time (x-axis) vs. severity (y-axis) of acute disease and...
Draw an XY graph that compares the time (x-axis) vs. severity (y-axis) of acute disease and chronic disease. (Eg. the natural history of disease)
0 0.051 6.4 0.164 12.9 0.28 19.3 0.382 25.7 0.499 Graph Absorbance (y-axis) vs Concentration (x-axis)....
0 0.051 6.4 0.164 12.9 0.28 19.3 0.382 25.7 0.499 Graph Absorbance (y-axis) vs Concentration (x-axis). What is the slope of the line? What is the concentration of the solution if the solution is 0.317? what would be the Absorptivity (ɛ) of the substance if the path length of the cuvette, b = 1 cm?
1. The goal on the Expected return (Y-axis) vs. Sigma (X-Axis) 2-dimensional graph is to have...
 1. The goal on the Expected return (Y-axis) vs. Sigma (X-Axis) 2-dimensional graph is to have a portfolio as much in the upper-left or north-west (NW) direction as possible, a. True b. False
1. Construct two plots with the following data a. plot 1: ΔT (oC) (y-axis) vs. moles of HCl (x-ax...
 1. Construct two plots with the following data
a. plot 1: ΔT (oC) (y-axis) vs. moles of HCl
(x-axis)
b. plot 2: qrxn (yaxis) vs. moles of HCl (x-axis).
(Use equations 3 and 2 from the lab handout to calculate the y-axis
values and 100.0 g as the mass of the solution.)
2. The complete neutralization of 0.0482 moles of a monoprotic
acid (HA) with excess NaOH evolves 2.58 kJ of heat. What is the
molar heat of neutralization of...
1. Construct two plots with the following data
a. plot 1: ΔT (oC) (y-axis) vs. moles of HCl
(x-axis)
b. plot 2: qrxn (yaxis) vs. moles of HCl (x-axis).
(Use equations 3 and 2 from the lab handout to calculate the y-axis
values and 100.0 g as the mass of the solution.)
2. The complete neutralization of 0.0482 moles of a monoprotic
acid (HA) with excess NaOH evolves 2.58 kJ of heat. What is the
molar heat of neutralization of...
Find the maximum area of a triangle formed in the first quadrant by the x-axis, y-axis, and a tangent line to the graph of y = (x+1)^-2
Find the maximum area of a triangle formed in the first quadrant by the x-axis, y-axis, and a tangent line to the graph of y = (x+1)^-2
The cost-volume-profit graph a. plots three separate lines. b. plots the total revenue line and the...
The cost-volume-profit graph a. plots three separate lines. b. plots the total revenue line and the total cost line. c. measures the vertical axis in units sold and the horizontal axis in dollars. d. All of these are correct.
Y=ax+b is the equation if a straight line. A student plot x vs y instead of...
Y=ax+b is the equation if a straight line. A student plot x vs y instead of y vs x, what will be the slope and the intercept on his graph in terms of a and b
7:32 0 . 18% 5 Col20628 il y Pow To (a) The graph below plots the...
 7:32 0 . 18% 5 Col20628 il y Pow To (a) The graph below plots the position versus time for an object moving in one dimension along the x direction. What is the speed (magnitude of velocity) of the object at. The graph plots position vs. time, not velocity vs. time. To find velocity, think about the definition of instantaneous velocity and how it is related to position. Notice the graph is a straight line from .. . Can you...
 A student plots the percent of sucrose in a beverage (x-axis) vs. the density (g/mL) (y-axis). The resulting trendline has the given equation: y = 0.501x + 0.975 Calculate the percent of sucrose in a beverage with a density of 1.125 g/mL. Select one: O 30% O 20% O 40% O 100%
 Question 3 (1 point) A student plots a graph of absorbance on the y axis and concentration on the x axis, generating a regression line of y = 2795x -0.0125. What is the concentration of the absorbing species in solution, if the percent transmittance is 42.8? 1.36x10⁻⁴M 1.27x10⁻⁴ M 8.404x10⁻⁴ M 1.55x10⁻⁴ M.
 1. The goal on the Expected return (Y-axis) vs. Sigma (X-Axis) 2-dimensional graph is to have a portfolio as much in the upper-left or north-west (NW) direction as possible, a. True b. False
 1. Construct two plots with the following data
a. plot 1: ΔT (oC) (y-axis) vs. moles of HCl
(x-axis)
b. plot 2: qrxn (yaxis) vs. moles of HCl (x-axis).
(Use equations 3 and 2 from the lab handout to calculate the y-axis
values and 100.0 g as the mass of the solution.)
2. The complete neutralization of 0.0482 moles of a monoprotic
acid (HA) with excess NaOH evolves 2.58 kJ of heat. What is the
molar heat of neutralization of...
1. Construct two plots with the following data
a. plot 1: ΔT (oC) (y-axis) vs. moles of HCl
(x-axis)
b. plot 2: qrxn (yaxis) vs. moles of HCl (x-axis).
(Use equations 3 and 2 from the lab handout to calculate the y-axis
values and 100.0 g as the mass of the solution.)
2. The complete neutralization of 0.0482 moles of a monoprotic
acid (HA) with excess NaOH evolves 2.58 kJ of heat. What is the
molar heat of neutralization of...
 7:32 0 . 18% 5 Col20628 il y Pow To (a) The graph below plots the position versus time for an object moving in one dimension along the x direction. What is the speed (magnitude of velocity) of the object at. The graph plots position vs. time, not velocity vs. time. To find velocity, think about the definition of instantaneous velocity and how it is related to position. Notice the graph is a straight line from .. . Can you...
Most questions answered within 3 hours.
-
Where is the error in this code sequence?
String s1 = "Hello";
String s2 = "ello";...
asked 10 months ago -
Financial data for Joel de Paris, Inc., for last year
follow:
Joel de Paris, Inc.
Balance...
asked 10 months ago -
Consider this reaction:
Al2(SO4)3 (aq)+ BaCl3
(aq) Al2Cl6 (aq)- +
3BaSO4(s) . What is the...
asked 10 months ago -
Suppose that Savneet is considering increasing her
recent random sample from 20 car rentals to 40...
asked 10 months ago -
Trucks arrive at an unloading terminal at an average rate of 120
per hour.
Trucks arrive...
asked 10 months ago -
Why are methanol and ethanol completely soluble in water while
octanol is not very little soluble....
asked 10 months ago -
A facilities manager at a university reads in a research report
that the mean amount of...
asked 10 months ago -
When the CuSO4 is rehydrated by adding water to the anhydrous
compound, is this an endothermic...
asked 10 months ago -
A ray of sunlight is passing from diamond into crown glass; the
angle of incidence is...
asked 10 months ago -
A block of mass 0.249 kg is placed on top of a light, vertical
spring of...
asked 10 months ago -
how do the kidneys compensate in the presences of acidosis
a) trigger hyperventilate
b) reserve acid...
asked 10 months ago -
Question 501 pts
The rental rate of capital to the firm increases. Which of the
following...
asked 10 months ago