Pick some jpeg/jpg images (Note that the images must not be offensive. If you choose to...
Pick some jpeg/jpg images (Note that the images must not be offensive. If you choose to submit images that are offensive to course staff it may be pursued as a violation of our academic integrity policy. Use your imagination but I trust you to act responsibly.) and for each one;
-
Apply compress_image with various tolerances to try to find values corresponding to compression rates of 50%, 80%, and 95%.
-
Plot the original image, and the three ”compressed” images, on a single page (use MATLAB’s subplot command). Clearly label the compression rate associated with each image on your plot.
Start with the provided function plotImages that should assist you with this process. Include your version of plotImages with your solution in addition to the plots.
function [ ] = plotImages( image_file)
% plotImages plots the image in image_file with various levels
%   of compression
%
% Consumed value:
% image_file is the name of a jpg/jpeg file in the current
5
-
% folder that will be displayed with approximately 50, 80, and 95%
-
% compression
orient landscape;
  % Experiment with the values of tol50, tol80, tol95
  % to achieve compressions rates close to 50%, 80%, and 95%
  P = imread(image_file);
  subplot(2,2,1);
  image(P);
  title(’Original Image’);
  axis off;
  subplot(2,2,2);
  tol50 = 29; % You have to adjust this value
  [cP50, comp50] = compress_image(P, tol50);
  image(cP50);
  title(strcat(’Compression Rate: ’,num2str(comp50)));
  axis off;
  subplot(2,2,3);
  tol80 = 116; % You have to adjust this value
  [cP80, comp80] = compress_image(P, tol80);
  image(cP80);
  title(strcat(’Compression Rate: ’,num2str(comp80)));
  axis off;
  subplot(2,2,4);
  tol95 = 2000; % You have to adjust this value
  [cP95, comp95] = compress_image(P, tol95);
  image(cP95);
  title(strcat(’Compression Rate: ’,num2str(comp95)));
  axis off;
  end
Homework Answers
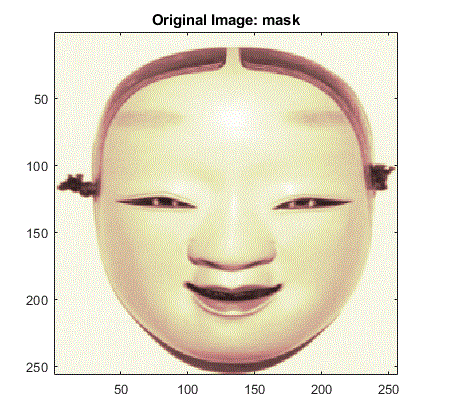
load mask
image(X)
axis square
colormap(pink(255))
title('Original Image: mask')
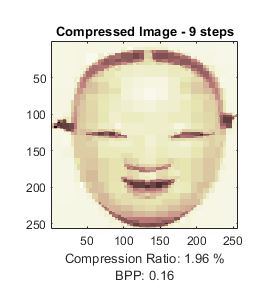
2) compressed:
subplot(1,2,1); image(X);
axis square;
title('Original Image')
subplot(1,2,2); image(Xc);
axis square;
title('Compressed Image')
xlabel({['Compression Ratio: ' num2str(CR,'%1.2f %%')], ...
['BPP: ' num2str(BPP,'%3.2f')]})
1,

Add Answer to:
Pick some jpeg/jpg images (Note that the images must not be
offensive. If you choose to...
the picture above is the one you are supposed to use for the MATlab code please...
 the picture above is the one you are supposed to use for the
MATlab code please help
Problems. Grayscale images are composed of a 2D matrix of light intensities from O (Black) to 255 (White). In this lab you will be using grayscale images and do 2D-array operations along with loops and iflelse branches. 1. We can regard 2D grayscale images as 2D arrays. Now load the provided image of scientists at the Solvay Conference in 1927 using the imread)...
the picture above is the one you are supposed to use for the
MATlab code please help
Problems. Grayscale images are composed of a 2D matrix of light intensities from O (Black) to 255 (White). In this lab you will be using grayscale images and do 2D-array operations along with loops and iflelse branches. 1. We can regard 2D grayscale images as 2D arrays. Now load the provided image of scientists at the Solvay Conference in 1927 using the imread)...
The following guidelines outline the basic template for a robot vacuum cleaner game. The game must be implemented in c programming language. It mimics a robotic vacuum cleaner. The code must only use...
The following guidelines outline the basic template for a robot vacuum cleaner game. The game must be implemented in c programming language. It mimics a robotic vacuum cleaner. The code must only use the following libraries: #include <math.h> #include <stdlib.h> #include <string.h> #include <limits.h> and any .graphics and .timers libraries. The guidelines are outlined as follows: Terminal Set-up: you may assume that the terminal will be quite large, for example, on the order of 150×50, or more. Status Display: The...
The following guidelines outline the basic template for a robot vacuum cleaner game. The game must...
The following guidelines outline the basic template for a robot vacuum cleaner game. The game must be implemented in c programming language. It mimics a robotic vacuum cleaner. The code must only use the following libraries: #include <math.h> #include <stdlib.h> #include <string.h> #include <limits.h> and any .graphics and .timers libraries. The guidelines are outlined as follows: Terminal Set-up: you may assume that the terminal will be quite large, for example, on the order of 150×50, or more. Status Display: The...
 the picture above is the one you are supposed to use for the
MATlab code please help
Problems. Grayscale images are composed of a 2D matrix of light intensities from O (Black) to 255 (White). In this lab you will be using grayscale images and do 2D-array operations along with loops and iflelse branches. 1. We can regard 2D grayscale images as 2D arrays. Now load the provided image of scientists at the Solvay Conference in 1927 using the imread)...
the picture above is the one you are supposed to use for the
MATlab code please help
Problems. Grayscale images are composed of a 2D matrix of light intensities from O (Black) to 255 (White). In this lab you will be using grayscale images and do 2D-array operations along with loops and iflelse branches. 1. We can regard 2D grayscale images as 2D arrays. Now load the provided image of scientists at the Solvay Conference in 1927 using the imread)...
Most questions answered within 3 hours.
-
Where is the error in this code sequence?
String s1 = "Hello";
String s2 = "ello";...
asked 11 months ago -
Financial data for Joel de Paris, Inc., for last year
follow:
Joel de Paris, Inc.
Balance...
asked 11 months ago -
Consider this reaction:
Al2(SO4)3 (aq)+ BaCl3
(aq) Al2Cl6 (aq)- +
3BaSO4(s) . What is the...
asked 11 months ago -
Suppose that Savneet is considering increasing her
recent random sample from 20 car rentals to 40...
asked 11 months ago -
Trucks arrive at an unloading terminal at an average rate of 120
per hour.
Trucks arrive...
asked 11 months ago -
Why are methanol and ethanol completely soluble in water while
octanol is not very little soluble....
asked 11 months ago -
A facilities manager at a university reads in a research report
that the mean amount of...
asked 11 months ago -
When the CuSO4 is rehydrated by adding water to the anhydrous
compound, is this an endothermic...
asked 11 months ago -
A ray of sunlight is passing from diamond into crown glass; the
angle of incidence is...
asked 11 months ago -
A block of mass 0.249 kg is placed on top of a light, vertical
spring of...
asked 11 months ago -
how do the kidneys compensate in the presences of acidosis
a) trigger hyperventilate
b) reserve acid...
asked 11 months ago -
Question 501 pts
The rental rate of capital to the firm increases. Which of the
following...
asked 11 months ago