Sue has $120 to spend on movies and dinners this month. The price of a dinner...
Sue has $120 to spend on movies and dinners this month. The price of a dinner is $20 and the price of a movie is $10.
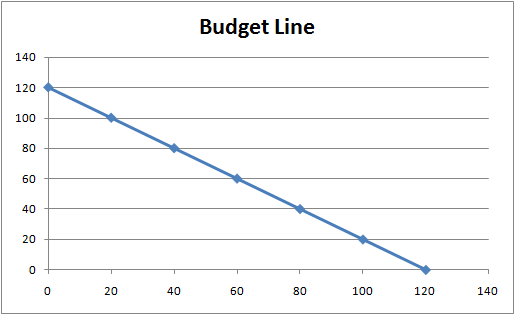
a. Draw the budget constraint with dinners on the x-axis and movies on the y-axis.
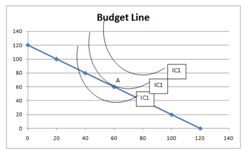
b. Graphically show Sue’s utility-maximizing bundle, assuming that both goods are normal goods.
c. Graphically show Sue’s utility-maximizing bundle, assuming that dinner is a normal good and movie is an inferior good.
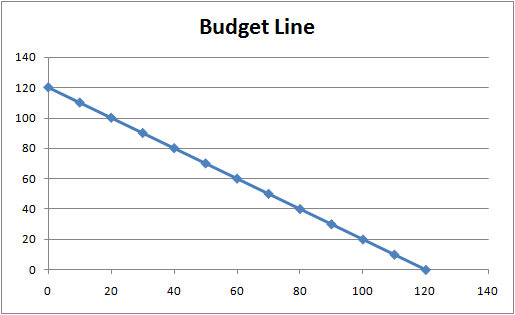
d. If the price of a dinner decreases from $20 to $10, draw the new budget constraint with dinners on the x-axis and movies on the y-axis.
e. Assume that both goods are normal goods.
i. The substitution effect of the increase in price of a dinner will make her consume (more/less) dinners.
ii. The substitution effect of the increase in price of a dinner will make her consume (more/less) movies.
iii. The income effect of the increase in price of a dinner will make her consume (more/less) dinners.
iv. The income effect of the increase in price of a dinner will make her consume (more/less) movies.
Homework Answers
Answer a)
Answer b)
Point A will be the maximum utility achived at this price.
Answer c)
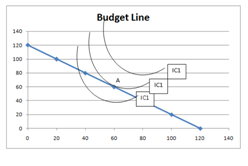
In the above graph indifference curve intersect budget line above A is the new point of maximum satifaction
Answer d)
Note:
In all the above graph Movies on Y axis and Dinner on X axis.
Add Answer to:
Sue has $120 to spend on movies and dinners this month. The
price of a dinner...
1. Suppose a consumer is maximizing utility consuming a bundle apples and bananas x and has...
 1. Suppose a consumer is maximizing utility consuming a bundle apples and bananas x and has standard preferences. Her budget constraint is given by the equation 1000-2a-2b0. Apples are normal goods and bananas are normal. a) plot the optimal bundle, showing the proper indifference curve and budget constraint. Call this bundle x1 b) show the effect of an increase of a single price increase for apples on the budget constraint. Use a hypothetical budget line to identify substitution effects for...
Joel has an income of $96, which he can spend on two (normal) goods: movies and...
Joel has an income of $96, which he can spend on two (normal) goods: movies and pizzas. Each movie costs $12 and each pizza costs $8. (a) Joel is considering buying bundle A, which is 3 movies and 5 pizzas. At that bundle, his marginal rate of substitution is 3 pizzas for 2 movies. Is the proposed bundle Joel’s optimal consumption bundle? If not, explain whether and why Joel buy more or fewer of each good to increase his utility....
2. Suppose Matt has $20 to spend on movies and books. The price of one unit...
2. Suppose Matt has $20 to spend on movies and books. The price of one unit of movie and the price of one unit of book are both $2. Assume movies and books are normal goods. a) Draw Matt’s budget line (Draw Movies on the X-axis). Suppose Matt optimally consumes 6 movies and 4 books. Label this bundle as point A on your graph, and draw the indifference curve associated with this bundle. b) Consider the bundle (5 movies, 5...
9. Income and substitution effects Felix and Janet Green live in Detroit and enjoy going out...
 9. Income and substitution effects
Felix and Janet Green live in Detroit and enjoy going out to
fancy restaurants for dinner and to diners for breakfast. On the
following diagram, the purple curves I1I1 and I2I2 represent two of
their indifference curves for fancy dinners and diner breakfasts.
They have $500 per month available to spend on eating out. The
price of a diner breakfast is always $5. Each labeled point
represents the tangency between a budget constraint and the...
9. Income and substitution effects
Felix and Janet Green live in Detroit and enjoy going out to
fancy restaurants for dinner and to diners for breakfast. On the
following diagram, the purple curves I1I1 and I2I2 represent two of
their indifference curves for fancy dinners and diner breakfasts.
They have $500 per month available to spend on eating out. The
price of a diner breakfast is always $5. Each labeled point
represents the tangency between a budget constraint and the...
9. Income and substitution effects Larry and Megan Stein live in Detroit and enjoy going out...
 9. Income and substitution effects Larry and Megan Stein live in Detroit and enjoy going out to fancy restaurants for dinner and to diners for breakfast. On the following diagram, the purple curves 11 and 12 represent two of their indifference curves for fancy dinners and diner breakfasts. They have $1,000 per month available to spend on eating out. The price of a diner breakfast is always $10. Each labeled point represents the tangency between a budget constraint and the...
9. Income and substitution effects Carlos and Deborah Azinian live in Detroit and enjoy going out...
 9. Income and substitution effects Carlos and Deborah Azinian live in Detroit and enjoy going out to fancy restaurants for dinner and to diners for breakfast. On the following diagram, the purple curves 11 and 12 represent two of their indifference curves for fancy dinners and diner breakfasts. They have $1,000 per month available to spend on eating out. The price of a diner breakfast is always $10. Each labeled point represents the tangency between a budget constraint and the...
Sean and Yvette Nag live in San Diego and enjoy going out to fancy restaurants for...
 Sean and Yvette Nag live in San Diego and enjoy going out to fancy restaurants for dinner and to diners for breakfast. On the following diagram, the purple curves 11 and 12 represent two of their indifference curves for fancy dinners and diner breakfasts. They have $1,000 per month available to spend on eating out. The price of a diner breakfast is always $10. Each labeled point represents the tangency between a budget constraint and the corresponding indifference curve. DINER...
Homework (Ch 21) 9. Income and substitution effects Andrew and Beth Trimble live in Philadelphia and...
 Homework (Ch 21) 9. Income and substitution effects Andrew and Beth Trimble live in Philadelphia and enjoy going out to fancy restaurants for dinner and to diners for breakfast. On the following diagram, the purple curves I, and I, represent two of their indifference curves for fancy dinners and diner breakfasts. They have $1,000 per month available to spend on eating out. The price of a diner breakfast is always $10. Each labeled point represents the tangency between a budget...
9. Income and substitution effects Dmitri and Frances Doherty live in Miami and enjoy going out...
 9. Income and substitution effects Dmitri and Frances Doherty live in Miami and enjoy going out to fancy restaurants for dinner and to diners for breakfast. On the following diagram, the purple curves 11 and 12 represent two of their indifference curves for fancy dinners and diner breakfasts. They have $1,000 per month available to spend on eating out. The price of a diner breakfast is always $10. Each labeled point represents the tangency between a budget constraint and the...
Homework (Ch 21) 9. Income and substitution effects Andrew and Beth Trimble live in Philadelphia and...
 Homework (Ch 21) 9. Income and substitution effects Andrew and Beth Trimble live in Philadelphia and enjoy going out to fancy restaurants for dinner and to diners for breakfast. On the following diagram, the purple curves I, and I, represent two of their indifference curves for fancy dinners and diner breakfasts. They have $1,000 per month available to spend on eating out. The price of a diner breakfast is always $10. Each labeled point represents the tangency between a budget...
 1. Suppose a consumer is maximizing utility consuming a bundle apples and bananas x and has standard preferences. Her budget constraint is given by the equation 1000-2a-2b0. Apples are normal goods and bananas are normal. a) plot the optimal bundle, showing the proper indifference curve and budget constraint. Call this bundle x1 b) show the effect of an increase of a single price increase for apples on the budget constraint. Use a hypothetical budget line to identify substitution effects for...
 9. Income and substitution effects
Felix and Janet Green live in Detroit and enjoy going out to
fancy restaurants for dinner and to diners for breakfast. On the
following diagram, the purple curves I1I1 and I2I2 represent two of
their indifference curves for fancy dinners and diner breakfasts.
They have $500 per month available to spend on eating out. The
price of a diner breakfast is always $5. Each labeled point
represents the tangency between a budget constraint and the...
9. Income and substitution effects
Felix and Janet Green live in Detroit and enjoy going out to
fancy restaurants for dinner and to diners for breakfast. On the
following diagram, the purple curves I1I1 and I2I2 represent two of
their indifference curves for fancy dinners and diner breakfasts.
They have $500 per month available to spend on eating out. The
price of a diner breakfast is always $5. Each labeled point
represents the tangency between a budget constraint and the...
 9. Income and substitution effects Larry and Megan Stein live in Detroit and enjoy going out to fancy restaurants for dinner and to diners for breakfast. On the following diagram, the purple curves 11 and 12 represent two of their indifference curves for fancy dinners and diner breakfasts. They have $1,000 per month available to spend on eating out. The price of a diner breakfast is always $10. Each labeled point represents the tangency between a budget constraint and the...
 9. Income and substitution effects Carlos and Deborah Azinian live in Detroit and enjoy going out to fancy restaurants for dinner and to diners for breakfast. On the following diagram, the purple curves 11 and 12 represent two of their indifference curves for fancy dinners and diner breakfasts. They have $1,000 per month available to spend on eating out. The price of a diner breakfast is always $10. Each labeled point represents the tangency between a budget constraint and the...
 Sean and Yvette Nag live in San Diego and enjoy going out to fancy restaurants for dinner and to diners for breakfast. On the following diagram, the purple curves 11 and 12 represent two of their indifference curves for fancy dinners and diner breakfasts. They have $1,000 per month available to spend on eating out. The price of a diner breakfast is always $10. Each labeled point represents the tangency between a budget constraint and the corresponding indifference curve. DINER...
 Homework (Ch 21) 9. Income and substitution effects Andrew and Beth Trimble live in Philadelphia and enjoy going out to fancy restaurants for dinner and to diners for breakfast. On the following diagram, the purple curves I, and I, represent two of their indifference curves for fancy dinners and diner breakfasts. They have $1,000 per month available to spend on eating out. The price of a diner breakfast is always $10. Each labeled point represents the tangency between a budget...
 9. Income and substitution effects Dmitri and Frances Doherty live in Miami and enjoy going out to fancy restaurants for dinner and to diners for breakfast. On the following diagram, the purple curves 11 and 12 represent two of their indifference curves for fancy dinners and diner breakfasts. They have $1,000 per month available to spend on eating out. The price of a diner breakfast is always $10. Each labeled point represents the tangency between a budget constraint and the...
 Homework (Ch 21) 9. Income and substitution effects Andrew and Beth Trimble live in Philadelphia and enjoy going out to fancy restaurants for dinner and to diners for breakfast. On the following diagram, the purple curves I, and I, represent two of their indifference curves for fancy dinners and diner breakfasts. They have $1,000 per month available to spend on eating out. The price of a diner breakfast is always $10. Each labeled point represents the tangency between a budget...
Most questions answered within 3 hours.
-
Where is the error in this code sequence?
String s1 = "Hello";
String s2 = "ello";...
asked 11 months ago -
Financial data for Joel de Paris, Inc., for last year
follow:
Joel de Paris, Inc.
Balance...
asked 11 months ago -
Consider this reaction:
Al2(SO4)3 (aq)+ BaCl3
(aq) Al2Cl6 (aq)- +
3BaSO4(s) . What is the...
asked 11 months ago -
Suppose that Savneet is considering increasing her
recent random sample from 20 car rentals to 40...
asked 11 months ago -
Trucks arrive at an unloading terminal at an average rate of 120
per hour.
Trucks arrive...
asked 11 months ago -
Why are methanol and ethanol completely soluble in water while
octanol is not very little soluble....
asked 11 months ago -
A facilities manager at a university reads in a research report
that the mean amount of...
asked 11 months ago -
When the CuSO4 is rehydrated by adding water to the anhydrous
compound, is this an endothermic...
asked 11 months ago -
A ray of sunlight is passing from diamond into crown glass; the
angle of incidence is...
asked 11 months ago -
A block of mass 0.249 kg is placed on top of a light, vertical
spring of...
asked 11 months ago -
how do the kidneys compensate in the presences of acidosis
a) trigger hyperventilate
b) reserve acid...
asked 11 months ago -
Question 501 pts
The rental rate of capital to the firm increases. Which of the
following...
asked 11 months ago