twenty eight 34 34 34 35 36 37 38 38 42 44 44 45 46 47...
| twenty eight |
| 34 |
| 34 |
| 34 |
| 35 |
| 36 |
| 37 |
| 38 |
| 38 |
| 42 |
| 44 |
| 44 |
| 45 |
| 46 |
| 47 |
| 47 |
| 48 |
| 48 |
| 51 |
| 53 |
| 54 |
| 54 |
| 57 |
| 58 |
| 58 |
| 59 |
| 59 |
| 61 |
| 62 |
| 62 |
| 63 |
| 63 |
| 64 |
| 64 |
| 64 |
| 66 |
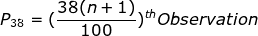
What is the percentile of thirtyeight
Homework Answers
First , to arrange the given observations in increasing orders
Here , n=35
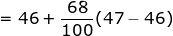
Therefore , the P38 is given by ,


1. Descriptive Statistics Data 20 25 40 41 42 43 44 45 46 47 48 49...
 1. Descriptive Statistics Data 20 25 40 41 42 43 44 45 46 47 48 49 50 50 51 52 53 54 55 56 57 58 59 60 65 80 90 For the data above calculate and draw the following: a. A Frequency Diagram with 7 classes. b. A Histogram C. A Stem and Leaf Diagram. Don't forget the instruction. d. The Five Number Summary e. The Box and Whisker Plot which needs the IQR, the Lower Fence and Upper...
NUMBER OF PEOPLE 10.2 10.0 10.1 8.5 10.2 8.2 8 Source: United States Census. 11. In...
 NUMBER OF PEOPLE 10.2 10.0 10.1 8.5 10.2 8.2 8 Source: United States Census. 11. In the Sanitary District of Chicago, operating engineers are hired on of a competitive civil-service examination. In 1966, there were 223 appl for 15 jobs. The exam was held on March 12; the test scores are s arranged in increasing order. The height of each bar in the histogram next page) shows the number of people with the correspondin examiners were charged with rigging the...
estimate the average age at which multiple sclerosis patients were diagnosed with the condition for the...
estimate the average age at which multiple sclerosis patients were diagnosed with the condition for the first time in a given city. How big should the sample be? Define your procedures for this estimate (if necessary, set your own values of unknown parameters, based on statistical theory). In Table 1 you will find all ages of this patient population. 54 58 56 48 62 59 55 56 60 52 53 61 56 56 53 37 71 62 39 61 54...
Problem 1: Confidence Interval for Percentage of B’s. The data set “STAT 250 Final Exam Scores”...
Problem 1: Confidence Interval for Percentage of B’s. The data set “STAT 250 Final Exam Scores” contains a random sample of 269 STAT 250 students’ final exam scores (maximum of 80) collected over the past two years. Answer the following questions using this data set. a) What proportion of students in our sample earned B’s on the final exam? A letter grade of B is obtained with a score of between 64 and 71 inclusive. Hint: You can do this...
Problem 4: Variables that may affect Grades The data set contains a random sample of STAT 250 Final Exam Scores out of 80 points. For each individual sampled, the time (in hours per week) that the stu...
Problem 4: Variables that may affect Grades The data set contains a random sample of STAT 250 Final Exam Scores out of 80 points. For each individual sampled, the time (in hours per week) that the student spent participating in a GMU club or sport and working for pay outside of GMU was recorded. Values of 0 indicate the students either does not participate in a club or sport or does not work a job for pay. The goal of...
Consider the below matrixA, which you can copy and paste directly into Matlab.
Problem #1: Consider the below matrix A, which you can copy and paste directly into Matlab. The matrix contains 3 columns. The first column consists of Test #1 marks, the second column is Test # 2 marks, and the third column is final exam marks for a large linear algebra course. Each row represents a particular student.A = [36 45 75 81 59 73 77 73 73 65 72 78 65 55 83 73 57 78 84 31 60 83...
For determining half-lives of radioactive isotopes, it is important to know what the background radiation is...
 For determining half-lives of radioactive isotopes, it is important to know what the background radiation is in a given detector over a specific period. The following data were taken in a y -ray detection experiment over 98 ten-second intervals: 58 50 57 58 64 63 54 64 59 41 43 56 60 50 46 59 54 60 59 60 67 52 65 63 55 61 68 58 63 36 42 54 58 54 40 60 64 56 61 51 48...
Suppose a binary tree data (in tiny written size) is stored in an array (A) as...
Suppose a binary tree data (in tiny written size) is stored in an array (A) as given below and root is placed at “0”index. Note the array indices are in larger written size (0 to 74). Show the traversal data of the given tree for a) In-Order Traversal b) Post Order Traversal A 0 1 2 3 4 5 6 7 8 9 10 11 12 13 14 3 28 13 36 15 9 22 44 7 10 75 33 19 15...
2:33 LTE X Statistics first homework.pdf 1 Descriptive Statistics Data 20 25 40 41 42 43...
 2:33 LTE X Statistics first homework.pdf 1 Descriptive Statistics Data 20 25 40 41 42 43 44 45 46 47 48 49 50 50 51 52 53 54 55 56 57 58 59 60 65 80 90 For the data above calculate and draw the following: a. A Frequency Diagram with 7 classes b.A Histogram A Stem and Leaf Diagram. Don't forget the instruction d. The Five Number Summary e. The Box and Whisker Plot which needs the IQR, the...
Find the mean of the following data set: 27, 28, 30, 41, 43, 44, 45, 51,...
 Find the mean of the following data set: 27, 28, 30, 41, 43, 44, 45, 51, 51, 53, 53, 54, 56, 56, 56, 57, 57, 58, 58, 59, 61, 62, 62, 62, 63, 64, 67, 68, 68, 68, 69, 69, 74 68 57 55.58
 1. Descriptive Statistics Data 20 25 40 41 42 43 44 45 46 47 48 49 50 50 51 52 53 54 55 56 57 58 59 60 65 80 90 For the data above calculate and draw the following: a. A Frequency Diagram with 7 classes. b. A Histogram C. A Stem and Leaf Diagram. Don't forget the instruction. d. The Five Number Summary e. The Box and Whisker Plot which needs the IQR, the Lower Fence and Upper...
 NUMBER OF PEOPLE 10.2 10.0 10.1 8.5 10.2 8.2 8 Source: United States Census. 11. In the Sanitary District of Chicago, operating engineers are hired on of a competitive civil-service examination. In 1966, there were 223 appl for 15 jobs. The exam was held on March 12; the test scores are s arranged in increasing order. The height of each bar in the histogram next page) shows the number of people with the correspondin examiners were charged with rigging the...
 For determining half-lives of radioactive isotopes, it is important to know what the background radiation is in a given detector over a specific period. The following data were taken in a y -ray detection experiment over 98 ten-second intervals: 58 50 57 58 64 63 54 64 59 41 43 56 60 50 46 59 54 60 59 60 67 52 65 63 55 61 68 58 63 36 42 54 58 54 40 60 64 56 61 51 48...
 2:33 LTE X Statistics first homework.pdf 1 Descriptive Statistics Data 20 25 40 41 42 43 44 45 46 47 48 49 50 50 51 52 53 54 55 56 57 58 59 60 65 80 90 For the data above calculate and draw the following: a. A Frequency Diagram with 7 classes b.A Histogram A Stem and Leaf Diagram. Don't forget the instruction d. The Five Number Summary e. The Box and Whisker Plot which needs the IQR, the...
 Find the mean of the following data set: 27, 28, 30, 41, 43, 44, 45, 51, 51, 53, 53, 54, 56, 56, 56, 57, 57, 58, 58, 59, 61, 62, 62, 62, 63, 64, 67, 68, 68, 68, 69, 69, 74 68 57 55.58
Most questions answered within 3 hours.
-
Where is the error in this code sequence?
String s1 = "Hello";
String s2 = "ello";...
asked 11 months ago -
Financial data for Joel de Paris, Inc., for last year
follow:
Joel de Paris, Inc.
Balance...
asked 11 months ago -
Consider this reaction:
Al2(SO4)3 (aq)+ BaCl3
(aq) Al2Cl6 (aq)- +
3BaSO4(s) . What is the...
asked 11 months ago -
Suppose that Savneet is considering increasing her
recent random sample from 20 car rentals to 40...
asked 11 months ago -
Trucks arrive at an unloading terminal at an average rate of 120
per hour.
Trucks arrive...
asked 11 months ago -
Why are methanol and ethanol completely soluble in water while
octanol is not very little soluble....
asked 11 months ago -
A facilities manager at a university reads in a research report
that the mean amount of...
asked 11 months ago -
When the CuSO4 is rehydrated by adding water to the anhydrous
compound, is this an endothermic...
asked 11 months ago -
A ray of sunlight is passing from diamond into crown glass; the
angle of incidence is...
asked 11 months ago -
A block of mass 0.249 kg is placed on top of a light, vertical
spring of...
asked 11 months ago -
how do the kidneys compensate in the presences of acidosis
a) trigger hyperventilate
b) reserve acid...
asked 11 months ago -
Question 501 pts
The rental rate of capital to the firm increases. Which of the
following...
asked 11 months ago