Question 1 (a) In a metal fabrication process, metal rods are produced that have an average...
Question 1
(a) In a metal fabrication process, metal rods are produced that
have an average length of
20.5 feet with a standard deviation of 2.3 feet. A quality control
specialist collects a random
sample of 30 rods and measures their lengths.
(i) Describe the sampling distribution for the sample mean by
naming the model and telling its
mean and standard deviation. [3 marks]
(ii) Calculate the probability that the sample mean length of metal
rods is less than 19.5 feet.
[2 marks]
(b) 47 packages are randomly selected from packages received by a
parcel service. The sample
has a mean weight of 25.6 pounds and a standard deviation of 2.8
pounds. What is the 95 percent
confidence interval for the true mean weight, μ, of all packages
received by the parcel service?
Interpret your answer. [5 marks]
Total 10 marks
Question 2
The health of employees is monitored by periodically weighing them
in. A sample of 54
employees has a mean weight of 183.9 lb. Assuming that σ is known
to be 121.2 lb, use a 0.10
significance level to test the claim that the population mean of
all such employees weights is less
than 200 lb.
(a) State the null and alternative hypotheses for the test. [3
marks]
(b) Calculate the value of the test statistic for this test. [2
marks]
(c) Calculate the p-value for this test. [2 marks]
(d) State the conclusion of this test. Give a reason for your
answer. [3 marks]
Total 10 marks
Question 3
A manufacturer considers his production process to be out of
control when defects exceed 3%. In
a random sample of 85 items, the defect rate is 5.9% but the
manager claims that this is only a
sample fluctuation and production is not really out of control. At
the 0.01 level of significance,
test the manager's claim.
(a) State the null and alternative hypotheses for the test. [3
marks]
(b) Calculate the value of the test statistic for this test. [2
marks]
(c) Determine the critical region(s) for this test. [2 marks]
(d) State the conclusion of this test. Give a reason for your
answer. [3 marks]
Total 10 marks
Question 4
The table below shows the age and favourite type of music of 668
randomly selected people.
|
Rock |
Pop |
Classical |
|
|
1525 |
50 |
85 |
73 |
|
25-35 |
68 |
91 |
60 |
|
35-45 |
90 |
74 |
77 |
Use a 5 percent level of significance to test the null
hypothesis that age and preferred music type
are independent.
(a) State the null and alternative hypotheses for this test. [2
marks]
(b) Calculate:
(i) the expected frequency, E21, for age 25-35 years and favourite
music is Rock
(ii) the chisquare contribution, χ2, for age 25-35 years and
favourite music is Rock
given that the chi-square test statistic, χ2, is 12.954, find the
p-value for test
[3 marks]
(c) State the conclusion for the test. [3 marks]
(d) State 2 limitations of the chi-square test, χ2.
Homework Answers
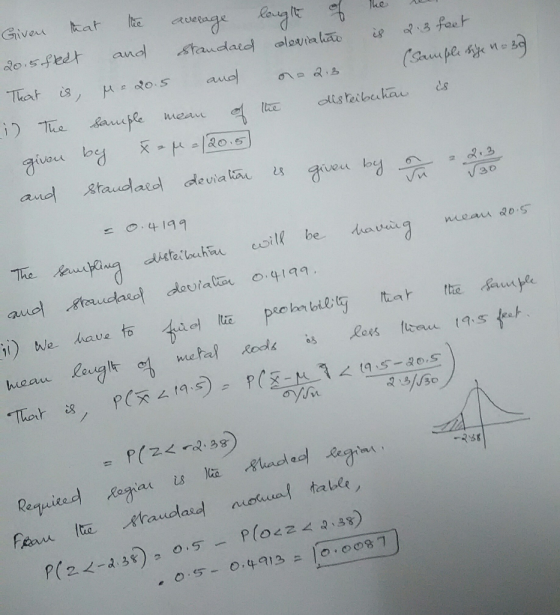
Let us answer question 1. For this we find the mean and standard deviation of the sample distribution and find the probability using them. The solution is as shown below.

Add Answer to:
Question 1
(a) In a metal fabrication process, metal rods are produced that
have an average...
Question 1 (a) In a metal fabrication process, metal rods are produced that have an average...
Question 1 (a) In a metal fabrication process, metal rods are produced that have an average length of 20.5 feet with a standard deviation of 2.3 feet. A quality control specialist collects a random sample of 30 rods and measures their lengths. (i) Describe the sampling distribution for the sample mean by naming the model and telling its mean and standard deviation. [3 marks] (ii) Calculate the probability that the sample mean length of metal rods is less than 19.5...
14. We want to determine the mean length of metal rods produced by factory by sampling...
14. We want to determine the mean length of metal rods produced by factory by sampling a random selection of metal rods. Previous records indicate the average length of the metal rods is 3.35 meters, with a standard deviation 0.15 meters. The factory is trying out a new manufacturing method and wants to determine whether this new method affects the mean length of the metal rods. a. State the null and alternative hypotheses. b. How many metal rods do we need...
A steel factory produces iron rods that are supposed to be 36 inches long. The machine...
A steel factory produces iron rods that are supposed to be 36 inches long. The machine that makes these rods does not produce each rod exactly 36 inches long. The lengths of these rods vary slightly. It is known that when the machine is working properly, the mean length of the rods is 36 inches. According to design, the standard deviation of the lengths of all rods produced on this machine is always equal to .05 inches. The quality control...
A steel factory produces iron rods that are supposed to be 36 inches long. The machine that makes...
A steel factory produces iron rods that are supposed to be 36 inches long. The machine that makes these rods does not produce each rod exactly 36 inches long. The lengths of these rods vary slightly. It is known that when the machine is working properly, the mean length of the rods is 36 inches. According to design, the standard deviation of the lengths of all rods produced on this machine is always equal to .05 inches. The quality control...
Is there a generation gap in the type of music that people listen to? The accompanying...
 Is there a generation gap in the type of music that people listen to? The accompanying table represents the type of favorite music for a sample of 1,000 respondents classified according to their age groups. At the 0.01 level of significance, is there evidence of a relationship between favorite type of music and age group? EClick the icon to view the table State the null and alternative hypotheses to test Ho T123 = T4 i Type of favorite music classified...
Is there a generation gap in the type of music that people listen to? The accompanying...
 Is there a generation gap in the type of music that people listen to? The accompanying table represents the type of favorite music for a sample of 1,000 respondents classified according to their age groups. At the 0.10 level of significance, is there evidence of a relationship between favorite type of music and age group? Click the icon to view the table. State the null and alternative hypotheses to test Но: Hа: Calculate the test statistic. XSTAT (Round to two...
Question 2 A manufacturer of sprinkler systems used for fire protection in office buildings claims that...
Question 2 A manufacturer of sprinkler systems used for fire protection in office buildings claims that the true average system-activation temperature is 130 degrees. A sample of 9 systems when tested yields a sample average activation temperature of 131.08 degrees. If the distribution of activation times is normal with standard deviation 1.5 degrees, test at the 1% level of significance to see if the data shows evidence that is different from the manufacturers claim. (a) State the null and alternative...
A manufacturer claims that the calling range (in feet) of its 900-MHz cordless telephone is greater...
A manufacturer claims that the calling range (in feet) of its 900-MHz cordless telephone is greater than that of its leading competitor. A sample of 99 phones from the manufacturer had a mean range of 13501350 feet with a standard deviation of 4242 feet. A sample of 1717 similar phones from its competitor had a mean range of 12801280 feet with a standard deviation of 2828 feet. Do the results support the manufacturer's claim? Let μ1μ1 be the true mean...
3. Do you see any striking difference between problem 1 and 2? At a certain university,...
3. Do you see any striking difference between problem 1 and 2? At a certain university, the mean income of parents of the entering class is reported to by $91,600. The president of another university feels that the parents’ income for her entering class is more than $91,600. She surveys 100 randomly selected families and finds the mean income to be $96,321. Given σ = $9555. With α = 0.05, is she correct? State the null and alternative hypotheses which...
A car dealer states that a new brand of car gets 35 miles per gallon on...
A car dealer states that a new brand of car gets 35 miles per gallon on average. Suppose a consumer group claims that these cars get less than 35 miles per gallon. A sample of 40 cars is selected, and the sample mean for the 40 cars is 33 miles per gallon while the sample standard deviation is 3.8. Have the assumptions for this test been met? Why or why not? State the null and alternative hypotheses for this test....
 Is there a generation gap in the type of music that people listen to? The accompanying table represents the type of favorite music for a sample of 1,000 respondents classified according to their age groups. At the 0.01 level of significance, is there evidence of a relationship between favorite type of music and age group? EClick the icon to view the table State the null and alternative hypotheses to test Ho T123 = T4 i Type of favorite music classified...
 Is there a generation gap in the type of music that people listen to? The accompanying table represents the type of favorite music for a sample of 1,000 respondents classified according to their age groups. At the 0.10 level of significance, is there evidence of a relationship between favorite type of music and age group? Click the icon to view the table. State the null and alternative hypotheses to test Но: Hа: Calculate the test statistic. XSTAT (Round to two...
Most questions answered within 3 hours.
-
Where is the error in this code sequence?
String s1 = "Hello";
String s2 = "ello";...
asked 10 months ago -
Financial data for Joel de Paris, Inc., for last year
follow:
Joel de Paris, Inc.
Balance...
asked 10 months ago -
Consider this reaction:
Al2(SO4)3 (aq)+ BaCl3
(aq) Al2Cl6 (aq)- +
3BaSO4(s) . What is the...
asked 10 months ago -
Suppose that Savneet is considering increasing her
recent random sample from 20 car rentals to 40...
asked 10 months ago -
Trucks arrive at an unloading terminal at an average rate of 120
per hour.
Trucks arrive...
asked 10 months ago -
Why are methanol and ethanol completely soluble in water while
octanol is not very little soluble....
asked 10 months ago -
A facilities manager at a university reads in a research report
that the mean amount of...
asked 10 months ago -
When the CuSO4 is rehydrated by adding water to the anhydrous
compound, is this an endothermic...
asked 10 months ago -
A ray of sunlight is passing from diamond into crown glass; the
angle of incidence is...
asked 10 months ago -
A block of mass 0.249 kg is placed on top of a light, vertical
spring of...
asked 10 months ago -
how do the kidneys compensate in the presences of acidosis
a) trigger hyperventilate
b) reserve acid...
asked 10 months ago -
Question 501 pts
The rental rate of capital to the firm increases. Which of the
following...
asked 10 months ago