A particular ranking system determines the cost of living in the most expensive cities in the...
A particular ranking system determines the cost of living in the most expensive cities in the world as an index. This index scales city X as 100 and expresses the cost of living in other cities as a percentage of the city X cost. For example, in 2007, the cost of living index in city Y was
125.7
,
which means that it was
26
%
higher than city X. The accompanying scatterplot shows the index for 2007 plotted against the 2006 index for
15
cities. Complete parts a through e below.
c) Find the correlation. The correlation coefficient is nothing . (Round to three decimal places as needed.)
| City | Index_2006 | Index_2007 |
| 1 | 117.3 | 125.7 |
| 2 | 121.8 | 122 |
| 3 | 102.3 | 104.3 |
| 4 | 93 | 95.8 |
| 5 | 111.7 | 119.6 |
| 6 | 112.9 | 124.8 |
| 7 | 95.3 | 97.3 |
| 8 | 109.9 | 111.5 |
| 9 | 100.5 | 101.8 |
| 10 | 95.8 | 103.6 |
| 11 | 121.2 | 121.4 |
| 12 | 119.3 | 124.6 |
| 13 | 105.9 | 118.3 |
| 14 | 111.2 | 119.4 |
| 15 | 111.3 | 115.8 |
Homework Answers
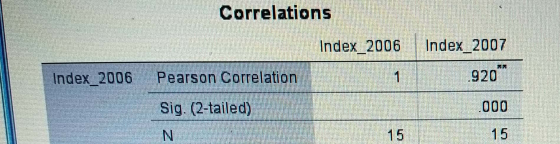
 The above table and graph is
showing the strong positive correlation beween index 2006 and index
2007 i.e. 0.920 and the p-value is 0.000 which is showing the
result is statistically significant.
The above table and graph is
showing the strong positive correlation beween index 2006 and index
2007 i.e. 0.920 and the p-value is 0.000 which is showing the
result is statistically significant.
Add Answer to:
A particular ranking system determines the cost of living in the
most expensive cities in the...
Most questions answered within 3 hours.
-
Where is the error in this code sequence?
String s1 = "Hello";
String s2 = "ello";...
asked 10 months ago -
Financial data for Joel de Paris, Inc., for last year
follow:
Joel de Paris, Inc.
Balance...
asked 10 months ago -
Consider this reaction:
Al2(SO4)3 (aq)+ BaCl3
(aq) Al2Cl6 (aq)- +
3BaSO4(s) . What is the...
asked 10 months ago -
Suppose that Savneet is considering increasing her
recent random sample from 20 car rentals to 40...
asked 10 months ago -
Trucks arrive at an unloading terminal at an average rate of 120
per hour.
Trucks arrive...
asked 10 months ago -
Why are methanol and ethanol completely soluble in water while
octanol is not very little soluble....
asked 10 months ago -
A facilities manager at a university reads in a research report
that the mean amount of...
asked 10 months ago -
When the CuSO4 is rehydrated by adding water to the anhydrous
compound, is this an endothermic...
asked 10 months ago -
A ray of sunlight is passing from diamond into crown glass; the
angle of incidence is...
asked 10 months ago -
A block of mass 0.249 kg is placed on top of a light, vertical
spring of...
asked 10 months ago -
how do the kidneys compensate in the presences of acidosis
a) trigger hyperventilate
b) reserve acid...
asked 10 months ago -
Question 501 pts
The rental rate of capital to the firm increases. Which of the
following...
asked 10 months ago