Assume the state of Alaska placed a tax on playing cards of 7 cents per pack....
Assume the state of Alaska placed a tax on playing cards of 7 cents per pack. If the state generated $42630 in revenue, how many packs of cards were sold?
Homework Answers
Answer
tax revenue =tax per good *goods
42630=0.07 Q
Q=42630/0.07
Q=609000
Number of packs of cards sol the Alaska is 609000 units
Add Answer to:
Assume the state of Alaska placed a tax on playing cards of 7
cents per pack....
Suppose the government imposes a $4-per-pack tax on suppliers.
 4. The Laffer curve Government-imposed taxes cause reductions in the activity that is being taxed, which has important implications for revenue collections. To understand the effect of such a tax, consider the monthly market for cigarettes, which is shown on the following graph. Use the graph input tool to help you answer the following questions. You will not be graded on any changes you make to this graph. Note: Once you enter a value in a white field, the graph and any corresponding amounts...
Question 35 (1 point) Suppose a state government imposes a tax on carbonated drinks. Before the...
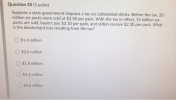 Question 35 (1 point) Suppose a state government imposes a tax on carbonated drinks. Before the tax, 20 million six packs were sold at $2.50 per pack. With the tax in effect, 14 million six packs are sold, buyers pay $3.10 per pack, and sellers receive $2.30 per pack. What is the deadweight loss resulting from the tax? $1.4 million $3.6 million $1.8 million $2.4 million $4.8 million
Figure 1.5 Price is per pack) ACTIVITIES $2.50 Tax t 1.50 1.25 COURSE TOC Demand 18...
 Figure 1.5 Price is per pack) ACTIVITIES $2.50 Tax t 1.50 1.25 COURSE TOC Demand 18 20 Quantity billions of packs per year) zoom 1 Refer to figure 1-5. The figure above represents demand and supply in the market for cigarettes. Use the diagram to answer the following questions How much is the government tax on each pack of cigarettes? b What portion of the unit tax is paid by consumers? PEOPLE What portion of the unit tax is paid...
Suppose the government imposes a $4-per-pack tax on suppliers.
 4. The Laffer curveGovernments often place so-called sin taxes on goods or services such as cigarettes and alcohol. These kinds of taxes are popular with politicians because they are usually more palatable to voters than income taxes.To understand the effect of such a tax, consider the monthly market for cigarettes, which is shown on the following graph.Use the graph input tool to help you answer the following questions. You will not be graded on any changes you make to this...
This exercise refers to a standard deck of playing cards. Assume that 5 cards are randomly chosen from the deck. How ma...
This exercise refers to a standard deck of playing cards. Assume that 5 cards are randomly chosen from the deck. How many hands contain exactly two 2s and two 8s?
3. Consider the market for Sharpie markers (Q is a pack of 3 markers.) Suppose that......
3. Consider the market for Sharpie markers (Q is a pack of 3 markers.) Suppose that... - The demand curve for Sharpie is QD = 20 – P - The supply curve for Sharpie is QS = 4P – 5 - The government imposes a tax of $1 per pack of Sharpies because of the foul smell (4 points each) a. Before the tax is implemented, what is the equilibrium price paid by buyers, price received by sellers, and the...
'In 2017 in Australia, 309 million packs of 25 cigarettes per pack were sold by Australian...
'In 2017 in Australia, 309 million packs of 25 cigarettes per pack were sold by Australian retailers, at an average price of $31 per pack. Illustrate the Australian legal cigarette market using a demand and supply diagram. Place the above numbers on your diagram.' Can I please have the above explained and how I plot this on a diagram correctly?
The data below indicate the state gas tax in cents per gallon and the fuel use...
 The data below indicate the state gas tax in cents per gallon and the fuel use per registered vehicle (in gallons). Tax (in cents) 31 1932 35 23 19 Usage (in gallons) 780.3 878.1 740.6 677.7 815.7 801.0 Source: American Petroleum Institute. Part 1 The correlation coefficient for the data is r = -0.875 and a = 0.05. Should regression analysis be done? The regression analysis should be done. Part 2 out of 3 Find the equation of the regression...
1) Pet Store (PS) sells a very popular blend of cat food at $20 per pack....
1) Pet Store (PS) sells a very popular blend of cat food at $20 per pack. Average weekly demand of this cat food at PS is 500 packs per week. The owner of the store, John Snow, orders the packs of cat food from the Ice & Fire Co. (I&F) at $15 per pack and have to pay a flat fee of $100 per order for shipping and handling. PS uses a fixed order size as their inventory policy. Assume that...
Suppose the government were considering increasing the federal tax on gasoline by 50 cents per gallon....
Suppose the government were considering increasing the federal tax on gasoline by 50 cents per gallon. in the course of hearings on the proposed legislation, a consumer advocate argued that the tax would simply be another burden on consumers, for gasoline producers would merely pass the tax on to consumers in the form of higher prices. Using your knowledge of Economics, analyze the consumer advocate's argument. in particular, use graphs to show the effect that this type of tax would...
 Question 35 (1 point) Suppose a state government imposes a tax on carbonated drinks. Before the tax, 20 million six packs were sold at $2.50 per pack. With the tax in effect, 14 million six packs are sold, buyers pay $3.10 per pack, and sellers receive $2.30 per pack. What is the deadweight loss resulting from the tax? $1.4 million $3.6 million $1.8 million $2.4 million $4.8 million
 Figure 1.5 Price is per pack) ACTIVITIES $2.50 Tax t 1.50 1.25 COURSE TOC Demand 18 20 Quantity billions of packs per year) zoom 1 Refer to figure 1-5. The figure above represents demand and supply in the market for cigarettes. Use the diagram to answer the following questions How much is the government tax on each pack of cigarettes? b What portion of the unit tax is paid by consumers? PEOPLE What portion of the unit tax is paid...
 The data below indicate the state gas tax in cents per gallon and the fuel use per registered vehicle (in gallons). Tax (in cents) 31 1932 35 23 19 Usage (in gallons) 780.3 878.1 740.6 677.7 815.7 801.0 Source: American Petroleum Institute. Part 1 The correlation coefficient for the data is r = -0.875 and a = 0.05. Should regression analysis be done? The regression analysis should be done. Part 2 out of 3 Find the equation of the regression...
Most questions answered within 3 hours.
-
Where is the error in this code sequence?
String s1 = "Hello";
String s2 = "ello";...
asked 11 months ago -
Financial data for Joel de Paris, Inc., for last year
follow:
Joel de Paris, Inc.
Balance...
asked 11 months ago -
Consider this reaction:
Al2(SO4)3 (aq)+ BaCl3
(aq) Al2Cl6 (aq)- +
3BaSO4(s) . What is the...
asked 11 months ago -
Suppose that Savneet is considering increasing her
recent random sample from 20 car rentals to 40...
asked 11 months ago -
Trucks arrive at an unloading terminal at an average rate of 120
per hour.
Trucks arrive...
asked 11 months ago -
Why are methanol and ethanol completely soluble in water while
octanol is not very little soluble....
asked 11 months ago -
A facilities manager at a university reads in a research report
that the mean amount of...
asked 11 months ago -
When the CuSO4 is rehydrated by adding water to the anhydrous
compound, is this an endothermic...
asked 11 months ago -
A ray of sunlight is passing from diamond into crown glass; the
angle of incidence is...
asked 11 months ago -
A block of mass 0.249 kg is placed on top of a light, vertical
spring of...
asked 11 months ago -
how do the kidneys compensate in the presences of acidosis
a) trigger hyperventilate
b) reserve acid...
asked 11 months ago -
Question 501 pts
The rental rate of capital to the firm increases. Which of the
following...
asked 11 months ago