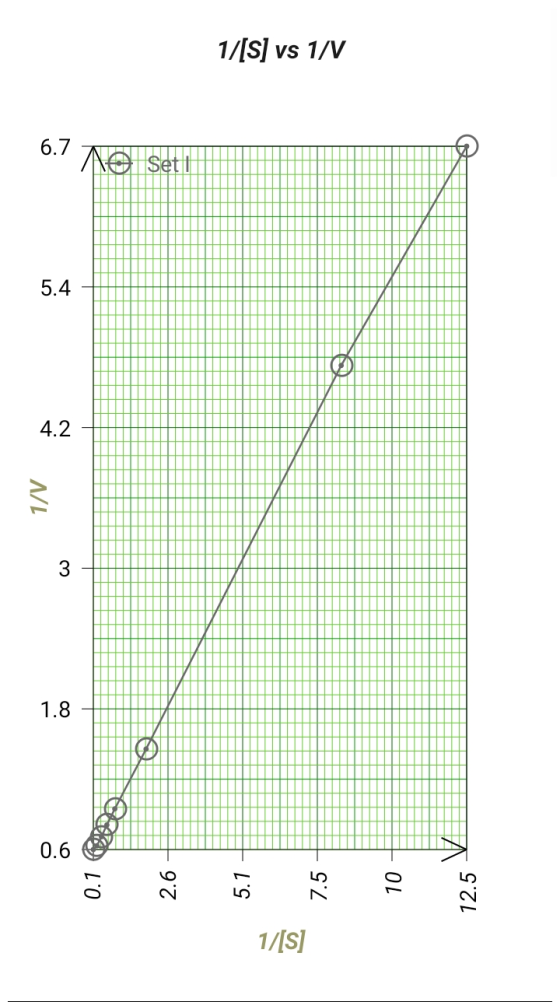
Substrate concentration (µM) Reaction rate (µmole/min) 0.08 0.15 0.12 0.21 0.54 0.7 1.23 1.1 1.82 1.3...
|
Substrate concentration (µM) |
Reaction rate (µmole/min) |
|
0.08 |
0.15 |
|
0.12 |
0.21 |
|
0.54 |
0.7 |
|
1.23 |
1.1 |
|
1.82 |
1.3 |
|
2.72 |
1.5 |
|
4.94 |
1.7 |
|
10 |
1.8 |
Construct a lineweaver graph using the data above. Please show how the Km and Vmax were determined.
Homework Answers
 I plot the graph of 1/V Vs
1/[S]. From the we get y intercept and slope to calculate the Vmax
and Km.
I plot the graph of 1/V Vs
1/[S]. From the we get y intercept and slope to calculate the Vmax
and Km.

Add Answer to:
Substrate concentration (µM)
Reaction rate (µmole/min)
0.08
0.15
0.12
0.21
0.54
0.7
1.23
1.1
1.82
1.3...
Name Page Number Date Vmax 1. Estimate Vmax and Km using the velocity vs. substrate concentration...
 Name Page Number Date Vmax 1. Estimate Vmax and Km using the velocity vs. substrate concentration plot - KM 2. Calculate the Vmax and Km using the Lineweaver-Burk plot. KM Vmax (S), uM 0.08 0.12 0.54 1.23 1.82 2.72 Reaction Velocity (UM/min) 0.15 0.21 0.70 1.1 1.3 15 4.94 10.00 1.8
(15 points) The following data is for a reaction catalyzed by tyrosine monoxygenase: Substrate Concentration (mol/L) ...
 (15 points) The following data is for a reaction
catalyzed by tyrosine monoxygenase:
Substrate
Concentration
(mol/L)
Initial Velocity (mM/min)
1.5
0.66
1.2
0.65
0.81
0.45
0.65
0.39
0.49
0.32
0.27
0.21
a) Plot the velocity (y-axis) versus substrate
concentration [S] (x-axis) curve and insert/draw the graph in the
space below. What are the approximate KM and
Vmax values?
b) Construct a 1/v (y-axis) versus 1/[S]
(x-axis) plot in the space below. Calculate the KM and
Vmax values.
c) Calculate the...
(15 points) The following data is for a reaction
catalyzed by tyrosine monoxygenase:
Substrate
Concentration
(mol/L)
Initial Velocity (mM/min)
1.5
0.66
1.2
0.65
0.81
0.45
0.65
0.39
0.49
0.32
0.27
0.21
a) Plot the velocity (y-axis) versus substrate
concentration [S] (x-axis) curve and insert/draw the graph in the
space below. What are the approximate KM and
Vmax values?
b) Construct a 1/v (y-axis) versus 1/[S]
(x-axis) plot in the space below. Calculate the KM and
Vmax values.
c) Calculate the...
 Name Page Number Date Vmax 1. Estimate Vmax and Km using the velocity vs. substrate concentration plot - KM 2. Calculate the Vmax and Km using the Lineweaver-Burk plot. KM Vmax (S), uM 0.08 0.12 0.54 1.23 1.82 2.72 Reaction Velocity (UM/min) 0.15 0.21 0.70 1.1 1.3 15 4.94 10.00 1.8
 (15 points) The following data is for a reaction
catalyzed by tyrosine monoxygenase:
Substrate
Concentration
(mol/L)
Initial Velocity (mM/min)
1.5
0.66
1.2
0.65
0.81
0.45
0.65
0.39
0.49
0.32
0.27
0.21
a) Plot the velocity (y-axis) versus substrate
concentration [S] (x-axis) curve and insert/draw the graph in the
space below. What are the approximate KM and
Vmax values?
b) Construct a 1/v (y-axis) versus 1/[S]
(x-axis) plot in the space below. Calculate the KM and
Vmax values.
c) Calculate the...
(15 points) The following data is for a reaction
catalyzed by tyrosine monoxygenase:
Substrate
Concentration
(mol/L)
Initial Velocity (mM/min)
1.5
0.66
1.2
0.65
0.81
0.45
0.65
0.39
0.49
0.32
0.27
0.21
a) Plot the velocity (y-axis) versus substrate
concentration [S] (x-axis) curve and insert/draw the graph in the
space below. What are the approximate KM and
Vmax values?
b) Construct a 1/v (y-axis) versus 1/[S]
(x-axis) plot in the space below. Calculate the KM and
Vmax values.
c) Calculate the...
Most questions answered within 3 hours.
-
Where is the error in this code sequence?
String s1 = "Hello";
String s2 = "ello";...
asked 10 months ago -
Financial data for Joel de Paris, Inc., for last year
follow:
Joel de Paris, Inc.
Balance...
asked 10 months ago -
Consider this reaction:
Al2(SO4)3 (aq)+ BaCl3
(aq) Al2Cl6 (aq)- +
3BaSO4(s) . What is the...
asked 10 months ago -
Suppose that Savneet is considering increasing her
recent random sample from 20 car rentals to 40...
asked 10 months ago -
Trucks arrive at an unloading terminal at an average rate of 120
per hour.
Trucks arrive...
asked 10 months ago -
Why are methanol and ethanol completely soluble in water while
octanol is not very little soluble....
asked 10 months ago -
A facilities manager at a university reads in a research report
that the mean amount of...
asked 10 months ago -
When the CuSO4 is rehydrated by adding water to the anhydrous
compound, is this an endothermic...
asked 10 months ago -
A ray of sunlight is passing from diamond into crown glass; the
angle of incidence is...
asked 10 months ago -
A block of mass 0.249 kg is placed on top of a light, vertical
spring of...
asked 10 months ago -
how do the kidneys compensate in the presences of acidosis
a) trigger hyperventilate
b) reserve acid...
asked 10 months ago -
Question 501 pts
The rental rate of capital to the firm increases. Which of the
following...
asked 10 months ago