Given two dependent random samples with the following results: Population 1 46 37 39 26 31...
Given two dependent random samples with the following results:
| Population 1 | 46 | 37 | 39 | 26 | 31 | 27 | 22 |
|---|---|---|---|---|---|---|---|
| Population 2 | 42 | 44 | 37 | 22 | 45 | 25 | 31 |
Use this data to find the 95% confidence interval for the true difference between the population means. Assume that both populations are normally distributed.
Step 1 of 4: Find the point estimate for the population mean of
the paired differences. Let x1 be the value from Population 1 and
x2 be the value from Population 2 and use the formula
d=x2−x1d=x2−x1 to calculate the paired differences. Round your
answer to one decimal place.
Step 2 of 4: Calculate the sample standard deviation of the paired differences. Round your answer to six decimal places.
Step 3 of 4: Calculate the margin of error to be used in constructing the confidence interval. Round your answer to six decimal places.
Step 4 of 4: Construct the 95%95% confidence interval. Round your answers to one decimal place.
Homework Answers
The statistical software output for this problem is :
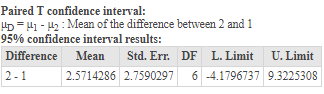
1)
point estimate = 2.6
2)
sample standard deviation = 7.299706
3)
Margin of error = 6.751102
4)
-4.2 to 9.3
Add Answer to:
Given two dependent random samples with the following
results:
Population 1
46
37
39
26
31...
Given two dependent random samples with the following results: Population 1 24 35 26 32 34...
Given two dependent random samples with the following results: Population 1 24 35 26 32 34 41 48 Population 2 20 31 39 25 22 34 39 Use this data to find the 95% confidence interval for the true difference between the population means. Assume that both populations are normally distributed. Copy Data Step 1 of 4: Find the point estimate for the population mean of the paired differences. Let x1 be the value from Population 1 and x2 be...
Given two dependent random samples with the following results: Population 1 3030 1515 2828 4444 2626...
Given two dependent random samples with the following results: Population 1 3030 1515 2828 4444 2626 4747 3232 Population 2 4444 2828 3636 3535 1818 3535 2222 Use this data to find the 95%95% confidence interval for the true difference between the population means. Assume that both populations are normally distributed. Copy Data Step 1 of 4: Find the point estimate for the population mean of the paired differences. Let x1x1 be the value from Population 1 and x2x2 be...
Given two dependent random samples with the following results: Population 1 41 33 18 34 42...
Given two dependent random samples with the following results: Population 1 41 33 18 34 42 39 50 Population 2 50 29 29 28 47 24 44 Use this data to find the 95% confidence interval for the true difference between the population means. Let d=(Population 1 entry)−(Population 2 entry) . Assume that both populations are normally distributed. Step 1 of 4: Find the mean of the paired differences, d ‾ . Round your answer to one decimal place. Step...
Given two dependent random samples with the following results: Population 1 4646 4747 3535 2525 3737...
Given two dependent random samples with the following results: Population 1 4646 4747 3535 2525 3737 2727 4848 Population 2 4242 3333 3737 2121 4646 4141 3535 Use this data to find the 98%98% confidence interval for the true difference between the population means. Let d=(Population 1 entry)−(Population 2 entry)d=(Population 1 entry)−(Population 2 entry). Assume that both populations are normally distributed. Copy Data Step 1 of 4: Find the mean of the paired differences, d‾‾d‾. Round your answer to one...
Given two dependent random samples with the following results: Population 1: 44, 39, 42, 31, 40,...
Given two dependent random samples with the following results: Population 1: 44, 39, 42, 31, 40, 36, 42 Population 2: 32, 32,, 27, 18, 38, 30, 37 Use this data to find the 95% confidence interval for the true difference between the population means. Let d=(Population 1 entry)−(Population 2 entry) Assume that both populations are normally distributed. Find the mean of the paired differences, find the critical value that should be used in constructing the confidence interval, and find the...
Given two dependent random samples with the following results: Population 1 34 34 34 20 27...
Given two dependent random samples with the following results: Population 1 34 34 34 20 27 18 41 Population 2 48 25 40 18 24 23 27 Use this data to find the 90% confidence interval for the true difference between the population means. Let d=(Population 1 entry)−(Population 2 entry)d=(Population 1 entry)−(Population 2 entry). Assume that both populations are normally distributed. Step 2 of 4: Find the critical value that should be used in constructing the confidence interval. Round your...
Step 2 of 4: Calculate the sample standard deviation of the paired differences. Round your answer...
 Step 2 of 4: Calculate the sample standard deviation of the
paired differences. Round your answer to six decimal places.
Step 3 of 4: Calculate the margin of error to be used in
constructing the confidence interval. Round your answer to six
decimal places.
Step 4 of 4: Construct the 90% confidence interval. Round your
answers to one decimal place
Given two dependent random samples with the following results: 31 18 32 20 17 32 Population 1 44 Population 2...
Step 2 of 4: Calculate the sample standard deviation of the
paired differences. Round your answer to six decimal places.
Step 3 of 4: Calculate the margin of error to be used in
constructing the confidence interval. Round your answer to six
decimal places.
Step 4 of 4: Construct the 90% confidence interval. Round your
answers to one decimal place
Given two dependent random samples with the following results: 31 18 32 20 17 32 Population 1 44 Population 2...
A state legislator wants to determine whether his voters' performance rating (0 - 100) has changed...
A state legislator wants to determine whether his voters' performance rating (0 - 100) has changed from last year to this year. The following table shows the legislator's performance from the same ten randomly selected voters for last year and this year. Use this data to find the 95% confidence interval for the true difference between the population means. Assume that the populations of voters' performance ratings are normally distributed for both this year and last year. Rating (last year)...
Step 1 of 4: Find the point estimate for the population mean of the paired differences....
 Step 1 of 4:
Find the point estimate for the population mean of the paired
differences. Let x1 be the blood pressure before taking the new
drug and x2 be the blood pressure after taking the new drug and use
the formula d=x2−x1 to calculate the paired differences. Round your
answer to one decimal place.
Step 2 of 4:
Calculate the sample standard deviation of the paired
differences. Round your answer to six decimal places.
Step 3 of 4:
Calculate...
Step 1 of 4:
Find the point estimate for the population mean of the paired
differences. Let x1 be the blood pressure before taking the new
drug and x2 be the blood pressure after taking the new drug and use
the formula d=x2−x1 to calculate the paired differences. Round your
answer to one decimal place.
Step 2 of 4:
Calculate the sample standard deviation of the paired
differences. Round your answer to six decimal places.
Step 3 of 4:
Calculate...
Given two independent random samples with the following results: ni = 15 n2 = 13 Xi...
 Given two independent random samples with the following results: ni = 15 n2 = 13 Xi = 153 X2 = 114 $i = 19 S2 = 21 Use this data to find the 95 % confidence interval for the true difference between the population means. Assume that the population variances are equal and that the two populations are normally distributed. Copy Data Step 1 of 3: Find the critical value that should be used in constructing the confidence interval. Round...
 Step 2 of 4: Calculate the sample standard deviation of the
paired differences. Round your answer to six decimal places.
Step 3 of 4: Calculate the margin of error to be used in
constructing the confidence interval. Round your answer to six
decimal places.
Step 4 of 4: Construct the 90% confidence interval. Round your
answers to one decimal place
Given two dependent random samples with the following results: 31 18 32 20 17 32 Population 1 44 Population 2...
Step 2 of 4: Calculate the sample standard deviation of the
paired differences. Round your answer to six decimal places.
Step 3 of 4: Calculate the margin of error to be used in
constructing the confidence interval. Round your answer to six
decimal places.
Step 4 of 4: Construct the 90% confidence interval. Round your
answers to one decimal place
Given two dependent random samples with the following results: 31 18 32 20 17 32 Population 1 44 Population 2...
 Step 1 of 4:
Find the point estimate for the population mean of the paired
differences. Let x1 be the blood pressure before taking the new
drug and x2 be the blood pressure after taking the new drug and use
the formula d=x2−x1 to calculate the paired differences. Round your
answer to one decimal place.
Step 2 of 4:
Calculate the sample standard deviation of the paired
differences. Round your answer to six decimal places.
Step 3 of 4:
Calculate...
Step 1 of 4:
Find the point estimate for the population mean of the paired
differences. Let x1 be the blood pressure before taking the new
drug and x2 be the blood pressure after taking the new drug and use
the formula d=x2−x1 to calculate the paired differences. Round your
answer to one decimal place.
Step 2 of 4:
Calculate the sample standard deviation of the paired
differences. Round your answer to six decimal places.
Step 3 of 4:
Calculate...
 Given two independent random samples with the following results: ni = 15 n2 = 13 Xi = 153 X2 = 114 $i = 19 S2 = 21 Use this data to find the 95 % confidence interval for the true difference between the population means. Assume that the population variances are equal and that the two populations are normally distributed. Copy Data Step 1 of 3: Find the critical value that should be used in constructing the confidence interval. Round...
Most questions answered within 3 hours.
-
Where is the error in this code sequence?
String s1 = "Hello";
String s2 = "ello";...
asked 10 months ago -
Financial data for Joel de Paris, Inc., for last year
follow:
Joel de Paris, Inc.
Balance...
asked 10 months ago -
Consider this reaction:
Al2(SO4)3 (aq)+ BaCl3
(aq) Al2Cl6 (aq)- +
3BaSO4(s) . What is the...
asked 10 months ago -
Suppose that Savneet is considering increasing her
recent random sample from 20 car rentals to 40...
asked 10 months ago -
Trucks arrive at an unloading terminal at an average rate of 120
per hour.
Trucks arrive...
asked 10 months ago -
Why are methanol and ethanol completely soluble in water while
octanol is not very little soluble....
asked 10 months ago -
A facilities manager at a university reads in a research report
that the mean amount of...
asked 10 months ago -
When the CuSO4 is rehydrated by adding water to the anhydrous
compound, is this an endothermic...
asked 10 months ago -
A ray of sunlight is passing from diamond into crown glass; the
angle of incidence is...
asked 10 months ago -
A block of mass 0.249 kg is placed on top of a light, vertical
spring of...
asked 10 months ago -
how do the kidneys compensate in the presences of acidosis
a) trigger hyperventilate
b) reserve acid...
asked 10 months ago -
Question 501 pts
The rental rate of capital to the firm increases. Which of the
following...
asked 10 months ago