The life span at birth of humans has a mean of 89.33 years and a standard...
The life span at birth of humans has a mean of 89.33 years and a standard deviation of 17.2 years. Calculate the upper and lower bounds of an interval containing 95% of the sample mean life spans at birth based on samples of 105 people. Give your answers to 2 decimal places.
Homework Answers

Add Answer to:
The life span at birth of humans has a mean of 89.33 years and a
standard...
A company manufactures light bulbs. The company wants the bulbs to have a mean life span...
A company manufactures light bulbs. The company wants the bulbs to have a mean life span of 991 hours. This average is maintained by periodically testing random samples of 16 light bulbs. If the t-value falls between -t0.95 and t0.95, then the company will be satisfied that it is manufacturing acceptable light bulbs. For a random sample, the mean life span of the sample is 999 hours and the standard deviation is 22 hours. Assume that life spans are approximately...
What is the life span of a lab mouse? You measured the following life spans (in...
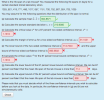 What is the life span of a lab mouse? You measured the following life spans (in days) for a certain standard inbred laboratory strain. 1025, 821.419, 771, 486, 1017, 657, 1151, 700, 752, 807, 924, 703, 1035 You may assume for the following questions that the distribution of life span is normal. (a) Calculate the sample mean x. 804.8571 b) Calculate the sample standard deviation s.210.9385 (c) Calculate the critical value tfor a 87 percent two-sided confidence interval. 1.1616X (a)...
Suppose a random variable has population mean -147 and population standard deviation 34.50. What is the...
Suppose a random variable has population mean -147 and population standard deviation 34.50. What is the lower and upper values of the probability interval containing 95% of the sample means of sample size n = 112? Lower = Upper = (Round to 3 decimal places.)
According to the Center for Disease Control and Prevention (CDC), the mean life expectancy in 2015...
 According to the Center for Disease Control and Prevention (CDC), the mean life expectancy in 2015 for Hispanic females was 84.3 years. Assume that the standard deviation was 15 years, as suggested by the Bureau of Economic Research. The distribution of age at death, X, is not normal because it is skewed to the left. Nevertheless, the distribution of the mean, x, in all possible samples of size n is approximately normal if n is large enough, by the central...
Based on interviews with 62 SARS patients, researchers found that the mean noutation period was 4.3...
 Based on interviews with 62 SARS patients, researchers found that the mean noutation period was 4.3 days, with a standard deviation of 14.9 days. Based on this information, construct a 95% confidence interval for the moon incubation period of the SARS virus. Interpret the interval The lower bound is days. (Round to two decimal places as needed.) The upper bound in days. (Round to two decimal places as needed) Interpret the interval Choose the correct answer below. O A There...
Based on interviews with 96 SARS patients, researchers found that the mean incubation period was 5...
 Based on interviews with 96 SARS patients, researchers found that the mean incubation period was 5 days, with a standard deviation of 15.4 days. Based on this information, construct a 95% confidence interval for the mean incubation period of the SARS virus. Interpret the interval. The lower bound is days. (Round to two decimal places as needed.) The upper bound is days. (Round to two decimal places as needed.) Interpret the interval. Choose the correct answer below. O A. There...
The average life span of a cheetah is eleven years with a standard deviation of 3....
The average life span of a cheetah is eleven years with a standard deviation of 3. Assume the life span of a cheetah to be normally distributed. What percentage of cheetahs live more than 10 years? Give your answer to 4 decimal places.
According to the Center for Disease Control and Prevention (CDC), the mean life expectancy in 2015...
 According to the Center for Disease Control and Prevention (CDC), the mean life expectancy in 2015 for Hispanic males was 79.3 years. Assume that the standard deviation was 15 years, as suggested by the Bureau of Economic Research. The distribution of age at death, X, is not normal because it is skewed to the left. Nevertheless, the distribution of the mean, x, in all possible samples of size n is approximately normal if n is large enough, by the central...
You are given the sample mean and the population standard deviation. Use this information to construct...
 You are given the sample mean and the population standard deviation. Use this information to construct the 90% and 95% confidence intervals for the population mean. Interpret the results and compare the widths of the confidence intervals. From a random sample of 64 dates, the mean record high daily temperature in a certain city has a mean of 85.80°F. Assume the population standard deviation is 15.07°F. The 90% confidence interval is (ID). (Round to two decimal places as needed.) The...
You are given the sample mean and the population standard deviation. Use this information to construct...
 You are given the sample mean and the population standard deviation. Use this information to construct the 90% and 95% confidence intervals for the population mean. Interpret the results and compare the widths of the confidence intervals From a random sample of 57 dates, the mean record high daily temperature in a certain city has a mean of 83.56°F. Assume the population standard deviation is 14 43°F. The 90% confidence interval is (0) (Round to two decimal places as needed.)...
 What is the life span of a lab mouse? You measured the following life spans (in days) for a certain standard inbred laboratory strain. 1025, 821.419, 771, 486, 1017, 657, 1151, 700, 752, 807, 924, 703, 1035 You may assume for the following questions that the distribution of life span is normal. (a) Calculate the sample mean x. 804.8571 b) Calculate the sample standard deviation s.210.9385 (c) Calculate the critical value tfor a 87 percent two-sided confidence interval. 1.1616X (a)...
 According to the Center for Disease Control and Prevention (CDC), the mean life expectancy in 2015 for Hispanic females was 84.3 years. Assume that the standard deviation was 15 years, as suggested by the Bureau of Economic Research. The distribution of age at death, X, is not normal because it is skewed to the left. Nevertheless, the distribution of the mean, x, in all possible samples of size n is approximately normal if n is large enough, by the central...
 Based on interviews with 62 SARS patients, researchers found that the mean noutation period was 4.3 days, with a standard deviation of 14.9 days. Based on this information, construct a 95% confidence interval for the moon incubation period of the SARS virus. Interpret the interval The lower bound is days. (Round to two decimal places as needed.) The upper bound in days. (Round to two decimal places as needed) Interpret the interval Choose the correct answer below. O A There...
 Based on interviews with 96 SARS patients, researchers found that the mean incubation period was 5 days, with a standard deviation of 15.4 days. Based on this information, construct a 95% confidence interval for the mean incubation period of the SARS virus. Interpret the interval. The lower bound is days. (Round to two decimal places as needed.) The upper bound is days. (Round to two decimal places as needed.) Interpret the interval. Choose the correct answer below. O A. There...
 According to the Center for Disease Control and Prevention (CDC), the mean life expectancy in 2015 for Hispanic males was 79.3 years. Assume that the standard deviation was 15 years, as suggested by the Bureau of Economic Research. The distribution of age at death, X, is not normal because it is skewed to the left. Nevertheless, the distribution of the mean, x, in all possible samples of size n is approximately normal if n is large enough, by the central...
 You are given the sample mean and the population standard deviation. Use this information to construct the 90% and 95% confidence intervals for the population mean. Interpret the results and compare the widths of the confidence intervals. From a random sample of 64 dates, the mean record high daily temperature in a certain city has a mean of 85.80°F. Assume the population standard deviation is 15.07°F. The 90% confidence interval is (ID). (Round to two decimal places as needed.) The...
 You are given the sample mean and the population standard deviation. Use this information to construct the 90% and 95% confidence intervals for the population mean. Interpret the results and compare the widths of the confidence intervals From a random sample of 57 dates, the mean record high daily temperature in a certain city has a mean of 83.56°F. Assume the population standard deviation is 14 43°F. The 90% confidence interval is (0) (Round to two decimal places as needed.)...
Most questions answered within 3 hours.
-
Where is the error in this code sequence?
String s1 = "Hello";
String s2 = "ello";...
asked 11 months ago -
Financial data for Joel de Paris, Inc., for last year
follow:
Joel de Paris, Inc.
Balance...
asked 11 months ago -
Consider this reaction:
Al2(SO4)3 (aq)+ BaCl3
(aq) Al2Cl6 (aq)- +
3BaSO4(s) . What is the...
asked 11 months ago -
Suppose that Savneet is considering increasing her
recent random sample from 20 car rentals to 40...
asked 11 months ago -
Trucks arrive at an unloading terminal at an average rate of 120
per hour.
Trucks arrive...
asked 11 months ago -
Why are methanol and ethanol completely soluble in water while
octanol is not very little soluble....
asked 11 months ago -
A facilities manager at a university reads in a research report
that the mean amount of...
asked 11 months ago -
When the CuSO4 is rehydrated by adding water to the anhydrous
compound, is this an endothermic...
asked 11 months ago -
A ray of sunlight is passing from diamond into crown glass; the
angle of incidence is...
asked 11 months ago -
A block of mass 0.249 kg is placed on top of a light, vertical
spring of...
asked 11 months ago -
how do the kidneys compensate in the presences of acidosis
a) trigger hyperventilate
b) reserve acid...
asked 11 months ago -
Question 501 pts
The rental rate of capital to the firm increases. Which of the
following...
asked 11 months ago