Use the given data to find the equation of the regression line. Round the final values...
Use the given data to find the equation of the regression line. Round the final values to one decimal place.
| x | 7 | 8 | 9 | 6 |
|---|---|---|---|---|
| y | 20 | 22 | 25 | 22 |
Homework Answers
Using excel<data<megastat<Correlation/regression<Scatterplot
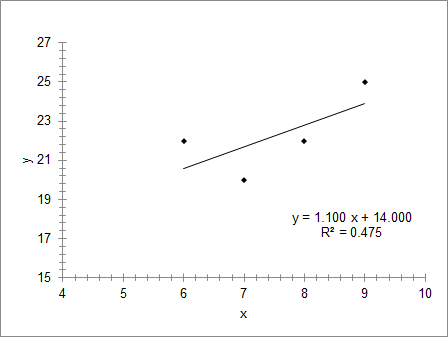
Regression equation= 14 + 1.1 x
Please do the comment for any doubt or clarification. Please upvote if this helps you out. Thank You!
Add Answer to:
Use the given data to find the equation of the regression line.
Round the final values...
Use the given data to find the equation of the regression line. Round the final values...
 Use the given data to find the equation of the regression line. Round the final values to three places, if necessary. (2. 13). (4. 11).(5,7) Oy=-3.79 +0.801X O y = 17.14 - 1.857x O 9=-2.79 +0.950x O 9 = -2.79 +0.897x
Use the given data to find the equation of the regression line. Round the final values...
 Use the given data to find the equation of the regression line. Round the final values to three significant digits, if necessary 27)計03 4512 27) y 8 269 12
Use the given data to find the equation of the regression line. Round the final values...
 Use the given data to find the equation of the regression line. Round the final values to three significant digits, if necessary. ху 1 143 3116 5 100 7 98 990 O y^= 150.7 - 6.8x O y^= 140.4 - 6.2x O y^= - 140.4 - 6.2x O y^= - 150.7 + 6.8x
Use the given data to find the equation of the regression line. Round the final values...
 Use the given data to find the equation of the regression line. Round the final values to three significant digits, if necessary. (47,8), (46, 10), (27, 10) 9 = 4.88 +0.625x 9 = 11.538 -0.055x 9 = 4.98 +0.725x ý = 4,98 +0.425x.
Use the given data to find the equation of the regression line. Round the final values...
 Use the given data to find the equation of the regression line. Round the final values to tenths, if necessary. Points: 5 17) 1.2 1.4 1.6 1.8 2.0 54 53 55 54 56 How did you find the equation of the regression line?
Use the given data to find the equation of the regression line. Round the final values...
 Use the given data to find the equation of the regression line. Round the final values to three significant digits, if necessary. Two different tests are designed to measure employee productivity and dexterity. Several employees are randomly selected and tested with these results. Productivity (x) 23 25 28 21 21 25 26 30 34 36 Dexterity () 4953 59 42 47 53 55 63 67 75 OAý 753-nay O 2 y = 2 38 + 2 033 Ocỹ = 10.7+1.53x...
ce the given data to find the equation of the regression line. Fill out the table...
 ce the given data to find the equation of the regression line. Fill out the table below and show how you calculate each value below. Round the final values of a and b to three decimal places, if necessary. 5) x 0 3 4 5 12 y 8 2 6 9 12 5) X-7 y-y (x-7)(y- 0 3 y 8 2 6 9 4 5 12 12 b=
Use the given data to find the equation of the regression line. Fill out the table...
 Use the given data to find the equation of the regression line. Fill out the table below and show how you calculate each value below. Round the final values of a and b to three decimal places, if necessary. 5) x 10 3 4 5 12 y 18 2 6 9 12 5) y = Y x-X y-у (x - 2)2 (x - x)(y-y) y 8 0 3 2 4 6 5 9 12 12 b = ge ý=
0 Use the given data to find the equation of the regression line. Examine the scatterplot...
 0 Use the given data to find the equation of the regression line. Examine the scatterplot and identify a characteristic of the data that is ignored by the regression line X 9 9 12 9 12 13 6 4 11 6 6 6.99 12.56 6.96 8.03 8.99 5.89 5.39 853 621 5.98 Create a scatterplot of the data. Choose the correct graph below y 7.45 ОА OB oc OD. Ay 25 20 20 15 10 5 26 20- 15 10...
 Use the given data to find the equation of the regression line. Round the final values to three places, if necessary. (2. 13). (4. 11).(5,7) Oy=-3.79 +0.801X O y = 17.14 - 1.857x O 9=-2.79 +0.950x O 9 = -2.79 +0.897x
 Use the given data to find the equation of the regression line. Round the final values to three significant digits, if necessary 27)計03 4512 27) y 8 269 12
 Use the given data to find the equation of the regression line. Round the final values to three significant digits, if necessary. ху 1 143 3116 5 100 7 98 990 O y^= 150.7 - 6.8x O y^= 140.4 - 6.2x O y^= - 140.4 - 6.2x O y^= - 150.7 + 6.8x
 Use the given data to find the equation of the regression line. Round the final values to three significant digits, if necessary. (47,8), (46, 10), (27, 10) 9 = 4.88 +0.625x 9 = 11.538 -0.055x 9 = 4.98 +0.725x ý = 4,98 +0.425x.
 Use the given data to find the equation of the regression line. Round the final values to tenths, if necessary. Points: 5 17) 1.2 1.4 1.6 1.8 2.0 54 53 55 54 56 How did you find the equation of the regression line?
 Use the given data to find the equation of the regression line. Round the final values to three significant digits, if necessary. Two different tests are designed to measure employee productivity and dexterity. Several employees are randomly selected and tested with these results. Productivity (x) 23 25 28 21 21 25 26 30 34 36 Dexterity () 4953 59 42 47 53 55 63 67 75 OAý 753-nay O 2 y = 2 38 + 2 033 Ocỹ = 10.7+1.53x...
 ce the given data to find the equation of the regression line. Fill out the table below and show how you calculate each value below. Round the final values of a and b to three decimal places, if necessary. 5) x 0 3 4 5 12 y 8 2 6 9 12 5) X-7 y-y (x-7)(y- 0 3 y 8 2 6 9 4 5 12 12 b=
 Use the given data to find the equation of the regression line. Fill out the table below and show how you calculate each value below. Round the final values of a and b to three decimal places, if necessary. 5) x 10 3 4 5 12 y 18 2 6 9 12 5) y = Y x-X y-у (x - 2)2 (x - x)(y-y) y 8 0 3 2 4 6 5 9 12 12 b = ge ý=
 Use the given data to find the equation of the regression line. Fill out the table below and show how you calculate each value below. Round the final values of a and b to three decimal places, if necessary. 5) x 10 3 4 5 12 y 18 2 6 9 12 5) y = Y x-X y-у (x - 2)2 (x - x)(y-y) y 8 0 3 2 4 6 5 9 12 12 b = ge ý=
 0 Use the given data to find the equation of the regression line. Examine the scatterplot and identify a characteristic of the data that is ignored by the regression line X 9 9 12 9 12 13 6 4 11 6 6 6.99 12.56 6.96 8.03 8.99 5.89 5.39 853 621 5.98 Create a scatterplot of the data. Choose the correct graph below y 7.45 ОА OB oc OD. Ay 25 20 20 15 10 5 26 20- 15 10...
Most questions answered within 3 hours.
-
Where is the error in this code sequence?
String s1 = "Hello";
String s2 = "ello";...
asked 11 months ago -
Financial data for Joel de Paris, Inc., for last year
follow:
Joel de Paris, Inc.
Balance...
asked 11 months ago -
Consider this reaction:
Al2(SO4)3 (aq)+ BaCl3
(aq) Al2Cl6 (aq)- +
3BaSO4(s) . What is the...
asked 11 months ago -
Suppose that Savneet is considering increasing her
recent random sample from 20 car rentals to 40...
asked 11 months ago -
Trucks arrive at an unloading terminal at an average rate of 120
per hour.
Trucks arrive...
asked 11 months ago -
Why are methanol and ethanol completely soluble in water while
octanol is not very little soluble....
asked 11 months ago -
A facilities manager at a university reads in a research report
that the mean amount of...
asked 11 months ago -
When the CuSO4 is rehydrated by adding water to the anhydrous
compound, is this an endothermic...
asked 11 months ago -
A ray of sunlight is passing from diamond into crown glass; the
angle of incidence is...
asked 11 months ago -
A block of mass 0.249 kg is placed on top of a light, vertical
spring of...
asked 11 months ago -
how do the kidneys compensate in the presences of acidosis
a) trigger hyperventilate
b) reserve acid...
asked 11 months ago -
Question 501 pts
The rental rate of capital to the firm increases. Which of the
following...
asked 11 months ago