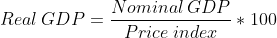
The following table gives nominal GDP and the price index for two years. Find real GDP...
The following table gives nominal GDP and the price index for two years.
Find real GDP in each year, and fill in the table. (Round your answers to two decimal places.)
|
Year |
Nominal GDP |
Price index |
Real GDP |
|
2010 |
5,600 |
110 |
|
|
2011 |
6 ,440 |
118 |
Homework Answers
|
Year |
Nominal GDP |
Price index |
Real GDP calculation |
Real GDP |
|
2010 |
5,600 |
110 |
(5,600/110) * 100 = 5090.91 |
5090.91 |
|
2011 |
6 ,440 |
118 |
(6 ,440/118) * 100 = 5457.63 |
5457.63 |
Formula used in calculation:
Add Answer to:
The following table gives nominal GDP and the price index for
two years.
Find real GDP...
The following table gives nominal GDP, real GDP, and the population for two years. Find per...
The following table gives nominal GDP, real GDP, and the population for two years. Find per capita real GDP in each year and fill in the table. (Round your answers to two decimal places.) Year Nominal GDP Real GDP Population Per Capita Real GDP 2010 5600 4870 100 2011 6048 5040 104
Based on the table below, calculate nominal GDP real GDP, the GDP deflator, and the infation...
 Based on the table below, calculate nominal GDP real GDP, the GDP deflator, and the infation rate in each year and fill in the missing parts of the table Use 2010 as the base year Instructions: Round nominal and real GDP values to two decimal places. Round GDP deflator and inflation rate values to the nearest whole number Quantity Price of Quantity Price of Real GOP ($) GOP deflator Inflation rate (%) Year of orange of beach beach ball GDP...
The following table shows nominal GDP and an appropriate price index for a group of selected year...
 The following table shows nominal GDP and an appropriate price index for a group of selected years. Compute real GDP. Indicate in each calculation whether you are inflating or deflating the nominal GDP data Instructions: Enter your responses in the gray-shaded cells. Round your answers to 2 decimal places. Nominal GDP Year 1968 1978 1988 1998 2008 Price Index 2005 100 22.01 40.40 66.98 85.51 108.48 Real GDP, Billions Effect on Nominal GDP Billions $909.80 2293.80 5100.40 8793.50 14441.40 0.00 increase /...
The following table shows nominal GDP and an appropriate price index for a 5 year period. Using the values in the...
 The following table shows nominal GDP and an appropriate price index for a 5 year period. Using the values in the table, calculate the value of real GDP for each year. Enter your response at whole numbers) dominal GOP Real GDP (illions Mons of dollars) Price Index of dollars) The economy above has experience OA rising price level O ring real GOP throughout the son of rang real GDP in only some of the O Click to select your answers)...
Based on the table below, calculate nominal GDP, real GDP, the GDP deflator, and the inflation...
 Based on the table below, calculate nominal GDP, real GDP, the GDP deflator, and the inflation rate in each year and fill in the missing parts of the table. Use 2014 as the base year. Instructions: Round nominal and real GDP values to two decimal places. Round GDP deflator and inflation rate values to the nearest whole number. Price of Quantity of Price of orange ($) Quantity of oranges 700 beach balls beach ball Nominal GDP ($) Real GDP ($)...
Based on the table below, calculate nominal GDP, real GDP, the GDP deflator, and the inflation...
 Based on the table below, calculate nominal GDP, real GDP, the GDP deflator, and the inflation rate in each year and fill in the missing parts of the table. Use 2014 as the base year. Instructions: Round nominal and real GDP values to two decimal places. Round GDP deflator and inflation rate values to the nearest whole number.
7. The following table shows nominal GDP and an appropriate price index for a group of...
 7. The following table shows nominal GDP and an appropriate price index for a group of selected years. Compute real GDP. Indicate in each calculation whether you are inflating or deflating the nominal GDP data, Instructions: Enter your responses in the gray-shaded cells. Round your answers to 2 decimal places. 0.74 points Real GDP, Billions Effect on Nominal GDP Year Book 1968 1978 1968 1995 2008 Nominal GDP Billions $914.80 2298.80 5105.40 8798 50 1446.40 Frice Index (2005 - 100)...
Year Nominal GDP (billions of $) Real GDP (billions of 2000 $) Price Index (2000 =...
Year Nominal GDP (billions of $) Real GDP (billions of 2000 $) Price Index (2000 = base year) Growth (%) in Real GDP from previous year 1977 2,030.9 4,750.5 42.8 6.4% 1978 2,294.7 45.8 1998 8,747.0 9,066.9 4.2% 1999 9,268.4 97.9 2000 9,817.0 9,817.0 2001 10,128.0 9,890.7 2002 10,487.0 10,074.8 104.1 2003 11,004.0 106.0 2004 11,735.0 108.3 6.What was the price index value for the US in the base year? 7.What was real GDP for the US in the year...
The following data show nominal GDP and the appropriate price index for several years. All GDP...
 The following data show nominal GDP and the appropriate price index for several years. All GDP are in billions. Use for questions 16 and 17. Nominal Price Year GDP level Real GDP index $117 124 143 149 96 178 112 220 143 **hint: only need Real GDP for years 1,5 and 6 16. The change in GDP from Year 1 to Year 6 is: a. Increase $56 billion b. Increase $46 billion c. Decrease $56 billion d. Decrease $46 billion...
The following table gives real GDP figures for an economy for four years. Fill in the growth rate for each yea...
 The following table gives real GDP figures for an economy for four years. Fill in the growth rate for each year, and then find the average annual growth rate for the period. Enter all answers as percentages rounded to one decimal place. Growth Rate ( % ) Real GDP Year 100 billion 1999 110.0 bilion 2000 121.0 bilion % 2001 128.3 billion % 2002 The average annual growth rate for this period is
 Based on the table below, calculate nominal GDP real GDP, the GDP deflator, and the infation rate in each year and fill in the missing parts of the table Use 2010 as the base year Instructions: Round nominal and real GDP values to two decimal places. Round GDP deflator and inflation rate values to the nearest whole number Quantity Price of Quantity Price of Real GOP ($) GOP deflator Inflation rate (%) Year of orange of beach beach ball GDP...
 The following table shows nominal GDP and an appropriate price index for a group of selected years. Compute real GDP. Indicate in each calculation whether you are inflating or deflating the nominal GDP data Instructions: Enter your responses in the gray-shaded cells. Round your answers to 2 decimal places. Nominal GDP Year 1968 1978 1988 1998 2008 Price Index 2005 100 22.01 40.40 66.98 85.51 108.48 Real GDP, Billions Effect on Nominal GDP Billions $909.80 2293.80 5100.40 8793.50 14441.40 0.00 increase /...
 The following table shows nominal GDP and an appropriate price index for a 5 year period. Using the values in the table, calculate the value of real GDP for each year. Enter your response at whole numbers) dominal GOP Real GDP (illions Mons of dollars) Price Index of dollars) The economy above has experience OA rising price level O ring real GOP throughout the son of rang real GDP in only some of the O Click to select your answers)...
 Based on the table below, calculate nominal GDP, real GDP, the GDP deflator, and the inflation rate in each year and fill in the missing parts of the table. Use 2014 as the base year. Instructions: Round nominal and real GDP values to two decimal places. Round GDP deflator and inflation rate values to the nearest whole number. Price of Quantity of Price of orange ($) Quantity of oranges 700 beach balls beach ball Nominal GDP ($) Real GDP ($)...
 7. The following table shows nominal GDP and an appropriate price index for a group of selected years. Compute real GDP. Indicate in each calculation whether you are inflating or deflating the nominal GDP data, Instructions: Enter your responses in the gray-shaded cells. Round your answers to 2 decimal places. 0.74 points Real GDP, Billions Effect on Nominal GDP Year Book 1968 1978 1968 1995 2008 Nominal GDP Billions $914.80 2298.80 5105.40 8798 50 1446.40 Frice Index (2005 - 100)...
 The following data show nominal GDP and the appropriate price index for several years. All GDP are in billions. Use for questions 16 and 17. Nominal Price Year GDP level Real GDP index $117 124 143 149 96 178 112 220 143 **hint: only need Real GDP for years 1,5 and 6 16. The change in GDP from Year 1 to Year 6 is: a. Increase $56 billion b. Increase $46 billion c. Decrease $56 billion d. Decrease $46 billion...
 The following table gives real GDP figures for an economy for four years. Fill in the growth rate for each year, and then find the average annual growth rate for the period. Enter all answers as percentages rounded to one decimal place. Growth Rate ( % ) Real GDP Year 100 billion 1999 110.0 bilion 2000 121.0 bilion % 2001 128.3 billion % 2002 The average annual growth rate for this period is
Most questions answered within 3 hours.
-
Where is the error in this code sequence?
String s1 = "Hello";
String s2 = "ello";...
asked 10 months ago -
Financial data for Joel de Paris, Inc., for last year
follow:
Joel de Paris, Inc.
Balance...
asked 10 months ago -
Consider this reaction:
Al2(SO4)3 (aq)+ BaCl3
(aq) Al2Cl6 (aq)- +
3BaSO4(s) . What is the...
asked 10 months ago -
Suppose that Savneet is considering increasing her
recent random sample from 20 car rentals to 40...
asked 10 months ago -
Trucks arrive at an unloading terminal at an average rate of 120
per hour.
Trucks arrive...
asked 10 months ago -
Why are methanol and ethanol completely soluble in water while
octanol is not very little soluble....
asked 10 months ago -
A facilities manager at a university reads in a research report
that the mean amount of...
asked 10 months ago -
When the CuSO4 is rehydrated by adding water to the anhydrous
compound, is this an endothermic...
asked 10 months ago -
A ray of sunlight is passing from diamond into crown glass; the
angle of incidence is...
asked 10 months ago -
A block of mass 0.249 kg is placed on top of a light, vertical
spring of...
asked 10 months ago -
how do the kidneys compensate in the presences of acidosis
a) trigger hyperventilate
b) reserve acid...
asked 10 months ago -
Question 501 pts
The rental rate of capital to the firm increases. Which of the
following...
asked 10 months ago