Develop a Scatter diagram for two variables of interest ( say pages in the newspaper by...
Develop a Scatter diagram for two variables of interest ( say pages in the newspaper by day of the week ) If you could include how to properly get the data right in the Excel Spreadsheet that would be super
Homework Answers
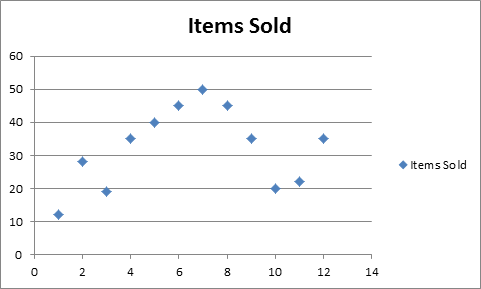
For developing a Scatter diagram for two variables of interest, the variables that I have selected are advertising budget for a different month (independent variable) and number of items sold (dependent variable).
- For developing a scatter diagram we first have to arrange this data in our spread sheet:
|
Month |
Advertising budget |
Items Sold |
|
JAN |
$ 40 |
12 |
|
FEB |
$50 |
28 |
|
MAR |
$45 |
19 |
|
APR |
$70 |
35 |
|
MAY |
$95 |
40 |
|
JUN |
$100 |
45 |
|
JUL |
$95 |
50 |
|
AUG |
$100 |
45 |
|
SEP |
$85 |
35 |
|
OCT |
$55 |
20 |
|
NOV |
$50 |
22 |
|
DEC |
$60 |
35 |
- Next we have to select the two columns with numeric data along with column heading.
- Next, we have to click on insert tab and select the scatter chart item under chart group.
- After selecting the format of scatter diagram we want, out chart will appear as follows:
Add Answer to:
Develop a Scatter diagram for two variables of interest ( say
pages in the newspaper by...
Scatter diagrams allow us to see relationships between two variables. Cite an example of two variables...
Scatter diagrams allow us to see relationships between two variables. Cite an example of two variables that might have a strong positive relationship. What would that scatter diagram look like? Next, cite an example of two variables that have very little relationship and describe what that scatter diagram would look like. Last, tell us why illustrating data in this way is helpful.
pr 1 X and Y are two random variables. A scatter diagram for a 15 different...
 pr 1 X and Y are two random variables. A scatter diagram for a 15 different samples of both random variables is illustrated below a. Suggest a convenient value for the covariance of X, Y 2 pt 2 t. Is X, Y independent? Why? If they are dependent and you know that X-10, what you could expect about Y? GOOD LUCK
MAT 203E: Assignment 2.2 In one to two pages, answer the following: Why is probability useful...
MAT 203E: Assignment 2.2 In one to two pages, answer the following: Why is probability useful for making better decisions? Your answer should include some discussion of the nature of probability, how we arrive at different probability outcomes, where we might get pertinent data, and how risk seeking or risk averse we are vis-à-vis probability percentages. Select variables that a Las Vegas casino might use in picking the probability of the Super Bowl winner six months before the game is...
The Scatter Diagram... A shows the type of correlation that may exist between two variables. B...
 The Scatter Diagram...
A
shows the type of correlation that may exist between two
variables.
B
shows the relationship between the mean and standard deviation
of the data.
C
displays the amount of variablility in multiple samples.
D
requires the data be plotted in time order sequence.
The Scatter Diagram...
A
shows the type of correlation that may exist between two
variables.
B
shows the relationship between the mean and standard deviation
of the data.
C
displays the amount of variablility in multiple samples.
D
requires the data be plotted in time order sequence.
Develop a scatter plot with HRS1 (how many hours per week one works) as the dependent variable and age as the independe...
Develop a scatter plot with HRS1 (how many hours per week one works) as the dependent variable and age as the independent variable. Include the estimated regression equation and the coefficient of determination on your scatter plot. Does there appear to be a relationship between these variables (HRS1 and age)? Briefly explain and justify your answer. Calculate the slope (b1) and intercept (b0) coefficients and use them to develop an estimated regression equation that can be used to predict HRS1...
a. Develop a scatter plot with HRS1 (how many hours per week one works) as the...
a. Develop a scatter plot with HRS1 (how many hours per week one works) as the dependent variable and age as the independent variable. Include the estimated regression equation and the coefficient of determination on your scatter plot. [ 1.5 points] b. Does there appear to be a relationship between these variables (HRS1 and age)? Briefly explain and justify your answer.[ 1 point] c. Calculate the slope (b1) and intercept (b0) coefficients and use them to develop an estimated regression...
Determine whether the scatter diagram indicates that a linear relation may exist between the two variables....
 Determine whether the scatter diagram indicates that a linear relation may exist between the two variables. If the relation is linear, determine whether it indicates a positive or negative association betweon the variables. Use this information to answer the following. 40 Explanatory Do the two variables have a linear relationship? The data points do not have a lir ear relationship because they i e nainty in。B. a straight line The data po nts have a linear relationship because they to...
X and Y are two random variables. A scatter diagram for a 15 differest samples of...
 X and Y are two random variables. A scatter diagram for a 15 differest samples of both tandom yariables is illustrated below 7 t. pt. a. | Suggest a convenient value for the covarance of X, Y . Is X. Y independeut? Why? If they are dependent and you know that X-10, what2 pt 2 pt. you conld expect about Y GOOD LUCK
and y Given are five observations for two variables, 7 20 17 13 29 13 48 52 58 a. Choose the correct scatter diagram f...
 and y Given are five observations for two variables, 7 20 17 13 29 13 48 52 58 a. Choose the correct scatter diagram for these data: B. 60- 60 50- 50 40 30- 30 20- 20 10- 10 40 60 x 50 30 60 v 20 10 4C 50 30 10 D C y y 60- 60 50- 50 40- 40 30- 30 60+ 60+ 50- 50- 40+ 40- 30+ 30- 20+ 20+ 10+ 10 10 20 30 40...
Viewing a scatter plot is an important step in understanding the relationship between two interval variables....
 Viewing a scatter plot is an important step in understanding the
relationship between two interval variables.
In a curvilinear relationship, the correlation alone can mask
the relationship between variables.
How would you calculate r and plot the scores in order
to see if your calculations accurately reflect the scatter
plot?
XY 10 Respondent 10
Viewing a scatter plot is an important step in understanding the
relationship between two interval variables.
In a curvilinear relationship, the correlation alone can mask
the relationship between variables.
How would you calculate r and plot the scores in order
to see if your calculations accurately reflect the scatter
plot?
XY 10 Respondent 10
 pr 1 X and Y are two random variables. A scatter diagram for a 15 different samples of both random variables is illustrated below a. Suggest a convenient value for the covariance of X, Y 2 pt 2 t. Is X, Y independent? Why? If they are dependent and you know that X-10, what you could expect about Y? GOOD LUCK
 The Scatter Diagram...
A
shows the type of correlation that may exist between two
variables.
B
shows the relationship between the mean and standard deviation
of the data.
C
displays the amount of variablility in multiple samples.
D
requires the data be plotted in time order sequence.
The Scatter Diagram...
A
shows the type of correlation that may exist between two
variables.
B
shows the relationship between the mean and standard deviation
of the data.
C
displays the amount of variablility in multiple samples.
D
requires the data be plotted in time order sequence.
 Determine whether the scatter diagram indicates that a linear relation may exist between the two variables. If the relation is linear, determine whether it indicates a positive or negative association betweon the variables. Use this information to answer the following. 40 Explanatory Do the two variables have a linear relationship? The data points do not have a lir ear relationship because they i e nainty in。B. a straight line The data po nts have a linear relationship because they to...
 X and Y are two random variables. A scatter diagram for a 15 differest samples of both tandom yariables is illustrated below 7 t. pt. a. | Suggest a convenient value for the covarance of X, Y . Is X. Y independeut? Why? If they are dependent and you know that X-10, what2 pt 2 pt. you conld expect about Y GOOD LUCK
 and y Given are five observations for two variables, 7 20 17 13 29 13 48 52 58 a. Choose the correct scatter diagram for these data: B. 60- 60 50- 50 40 30- 30 20- 20 10- 10 40 60 x 50 30 60 v 20 10 4C 50 30 10 D C y y 60- 60 50- 50 40- 40 30- 30 60+ 60+ 50- 50- 40+ 40- 30+ 30- 20+ 20+ 10+ 10 10 20 30 40...
 Viewing a scatter plot is an important step in understanding the
relationship between two interval variables.
In a curvilinear relationship, the correlation alone can mask
the relationship between variables.
How would you calculate r and plot the scores in order
to see if your calculations accurately reflect the scatter
plot?
XY 10 Respondent 10
Viewing a scatter plot is an important step in understanding the
relationship between two interval variables.
In a curvilinear relationship, the correlation alone can mask
the relationship between variables.
How would you calculate r and plot the scores in order
to see if your calculations accurately reflect the scatter
plot?
XY 10 Respondent 10
Most questions answered within 3 hours.
-
Where is the error in this code sequence?
String s1 = "Hello";
String s2 = "ello";...
asked 10 months ago -
Financial data for Joel de Paris, Inc., for last year
follow:
Joel de Paris, Inc.
Balance...
asked 10 months ago -
Consider this reaction:
Al2(SO4)3 (aq)+ BaCl3
(aq) Al2Cl6 (aq)- +
3BaSO4(s) . What is the...
asked 10 months ago -
Suppose that Savneet is considering increasing her
recent random sample from 20 car rentals to 40...
asked 10 months ago -
Trucks arrive at an unloading terminal at an average rate of 120
per hour.
Trucks arrive...
asked 10 months ago -
Why are methanol and ethanol completely soluble in water while
octanol is not very little soluble....
asked 10 months ago -
A facilities manager at a university reads in a research report
that the mean amount of...
asked 10 months ago -
When the CuSO4 is rehydrated by adding water to the anhydrous
compound, is this an endothermic...
asked 10 months ago -
A ray of sunlight is passing from diamond into crown glass; the
angle of incidence is...
asked 10 months ago -
A block of mass 0.249 kg is placed on top of a light, vertical
spring of...
asked 10 months ago -
how do the kidneys compensate in the presences of acidosis
a) trigger hyperventilate
b) reserve acid...
asked 10 months ago -
Question 501 pts
The rental rate of capital to the firm increases. Which of the
following...
asked 10 months ago