control chart for x bar and sigma chart
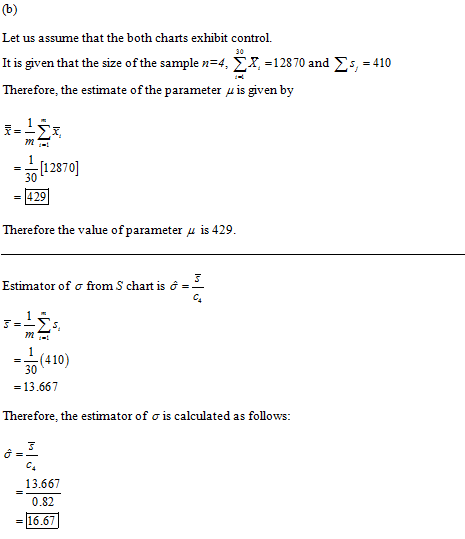
Control charts for x bar and s are maintained on a quality characteristic. The sample size is n=4. After 30 samples, we obtain
3030
∑ ¯xi=12,870and∑ sj=410
i=1i=1
A. Find the centerline and three sigma control limits for the s chart.
B. Assuming that both charts exhibit control,estimate the aprameters μ and σ.
Homework Answers


04)- 244+3-15 marás) Control charts for X and R are mairnt S marks) Contr ol charts for X and R are maintained for quality characteristic. The and R are computed for each sample. After 30 samples,...
 04)- 244+3-15 marás) Control charts for X and R are mairnt S marks) Contr ol charts for X and R are maintained for quality characteristic. The and R are computed for each sample. After 30 samples, the following a computed: 6690 R-1030 a- What are the tria Ilimits for the R chart ? tb) Assuming that the R chart is in control, what are the trial limits for the X char? Estimate the process mean and standard devintion. (d- Ifthe...
A control chart is used for monitoring a process meanl (X) that is normally distributed with a mean of μ and a standard...
 A control chart is used for monitoring a process meanl (X) that is normally distributed with a mean of μ and a standard deviation of σχ , and the sample size is n-5. А 3-sigma limit (μ ±30% ) is used as control limits. Two decision rules are given here. Rule 1: If one or more of the next seven samples yield values of the sample average that fall outside the control limits, conclude that the process is out of...
Control charts for and R are to be set up for an important quality characteristic. The...
 Control charts for and R are to be set up for an important quality characteristic. The sample size is n 5, and X and r are computed for each of 35 preliminary samples. The summary data are: X,7802 and ,r 1180 Round your answers to 2 decimal places (e.g. 98.76). (a) Find trial control limits forand R charts. X Control Limits UCL- CL= LCL- 3. R Control Limits: UCL LCL = (b) Assuming that the pracess is in control, estimate...
Control charts for bar x chart and S have been maintained on a process and have...
 Control charts for bar x chart and S have been maintained on a process and have exhibited statistical control. The sample size is n=6. The control chart parameters are as follows: Estimate the mean and standard deviation of the process. Assume that the process output is well modeled by a normal distribution. If specifications are 703 and 709, estimate the fraction nonconforming. Suppose the process mean shifts to 702.00 while the standard deviation remains constant. What is the probability of...
Consider a ? 2 control chart for monitoring p = 10 quality characteristics. Suppose that the...
Consider a ? 2 control chart for monitoring p = 10 quality characteristics. Suppose that the subgroup size is n = 3 and there are 25 preliminary samples available to estimate the sample covariance matrix. a) Find the phase II control limits assuming that ? = 0.005
2. A process has a X-bar control chart with UCL=17.4, LCL=12.79 using a 3- sigma limit....
 2. A process has a X-bar control chart with UCL=17.4, LCL=12.79 using a 3- sigma limit. The subgroup sample size is 3. (a) Estimate the standard deviation of the process, sigma hat. (6 pts) (b) Suppose that the process mean shifts to 13. Find the probability that this shift will be detected on the next sample. (8 pts) (c) Calculate the average run length (ARL) before detecting the shift. (6 pts)
A control chart is used for monitoring a process mean ( 7 ) that is normally...
 A control chart is used for monitoring a process mean ( 7 ) that is normally distributed with a mean of u and a standard deviation of o, and the sample size is n = 5. A 3-sigma limit (u +30z) is used as control limits. Two decision rules are given here. Rule 1: If one or more of the next seven samples yield values of the sample average that fall outside the control limits, conclude that the process is...
An chart with three-sigma limits has parameters as follows: Suppose the process quality characteristic being controlled...
 An chart with three-sigma limits has parameters as follows: Suppose the process quality characteristic being controlled is normally distributed with a true mean of 98 and a standard deviation of 8. What is the probability that the control chart would exhibit lack of control by at least the third point plotted?
Refer to Table 56.1 - Factors for Computing Control Chart Limits (sigma) for this problem. Thirty-five...
 Refer to Table 56.1 - Factors for Computing Control Chart Limits (sigma) for this problem. Thirty-five samples of size 7 each were taken from a fertilizer-bag-filling machine at Panos Kouvels Lifelong Lawn Lid. The results were: Overal mean = 54.75 lb.: Average range R 164 b. a) For the given sample size, the control limits for 3-sigma x chart are Upper Control Limit (UCL) - D. (round your response to three decimal places). Lower Control Limit (LCL)-1. (round your response...
Problem no.3 The thickness of a metal part is the quality characteristic that statistical process control...
 Problem no.3 The thickness of a metal part is the quality characteristic that statistical process control is being applied to. Measurements are taken from 25 subgroups of subgroup size 5. The sum of the X-bar values 1.5735. The sum of the R-values .0231. Xbar/R Chart for x 0636 06396 Subgroup 10 15 20 25 001 0011 a.) Calculate the trial control limits and centerlines for the X-bar and R charts above b.) Calculate the revised control limits and centerlines for...
 04)- 244+3-15 marás) Control charts for X and R are mairnt S marks) Contr ol charts for X and R are maintained for quality characteristic. The and R are computed for each sample. After 30 samples, the following a computed: 6690 R-1030 a- What are the tria Ilimits for the R chart ? tb) Assuming that the R chart is in control, what are the trial limits for the X char? Estimate the process mean and standard devintion. (d- Ifthe...
 A control chart is used for monitoring a process meanl (X) that is normally distributed with a mean of μ and a standard deviation of σχ , and the sample size is n-5. А 3-sigma limit (μ ±30% ) is used as control limits. Two decision rules are given here. Rule 1: If one or more of the next seven samples yield values of the sample average that fall outside the control limits, conclude that the process is out of...
 Control charts for and R are to be set up for an important quality characteristic. The sample size is n 5, and X and r are computed for each of 35 preliminary samples. The summary data are: X,7802 and ,r 1180 Round your answers to 2 decimal places (e.g. 98.76). (a) Find trial control limits forand R charts. X Control Limits UCL- CL= LCL- 3. R Control Limits: UCL LCL = (b) Assuming that the pracess is in control, estimate...
 Control charts for bar x chart and S have been maintained on a process and have exhibited statistical control. The sample size is n=6. The control chart parameters are as follows: Estimate the mean and standard deviation of the process. Assume that the process output is well modeled by a normal distribution. If specifications are 703 and 709, estimate the fraction nonconforming. Suppose the process mean shifts to 702.00 while the standard deviation remains constant. What is the probability of...
 2. A process has a X-bar control chart with UCL=17.4, LCL=12.79 using a 3- sigma limit. The subgroup sample size is 3. (a) Estimate the standard deviation of the process, sigma hat. (6 pts) (b) Suppose that the process mean shifts to 13. Find the probability that this shift will be detected on the next sample. (8 pts) (c) Calculate the average run length (ARL) before detecting the shift. (6 pts)
 A control chart is used for monitoring a process mean ( 7 ) that is normally distributed with a mean of u and a standard deviation of o, and the sample size is n = 5. A 3-sigma limit (u +30z) is used as control limits. Two decision rules are given here. Rule 1: If one or more of the next seven samples yield values of the sample average that fall outside the control limits, conclude that the process is...
 An chart with three-sigma limits has parameters as follows: Suppose the process quality characteristic being controlled is normally distributed with a true mean of 98 and a standard deviation of 8. What is the probability that the control chart would exhibit lack of control by at least the third point plotted?
 Refer to Table 56.1 - Factors for Computing Control Chart Limits (sigma) for this problem. Thirty-five samples of size 7 each were taken from a fertilizer-bag-filling machine at Panos Kouvels Lifelong Lawn Lid. The results were: Overal mean = 54.75 lb.: Average range R 164 b. a) For the given sample size, the control limits for 3-sigma x chart are Upper Control Limit (UCL) - D. (round your response to three decimal places). Lower Control Limit (LCL)-1. (round your response...
 Problem no.3 The thickness of a metal part is the quality characteristic that statistical process control is being applied to. Measurements are taken from 25 subgroups of subgroup size 5. The sum of the X-bar values 1.5735. The sum of the R-values .0231. Xbar/R Chart for x 0636 06396 Subgroup 10 15 20 25 001 0011 a.) Calculate the trial control limits and centerlines for the X-bar and R charts above b.) Calculate the revised control limits and centerlines for...
Most questions answered within 3 hours.
-
Where is the error in this code sequence?
String s1 = "Hello";
String s2 = "ello";...
asked 10 months ago -
Financial data for Joel de Paris, Inc., for last year
follow:
Joel de Paris, Inc.
Balance...
asked 10 months ago -
Consider this reaction:
Al2(SO4)3 (aq)+ BaCl3
(aq) Al2Cl6 (aq)- +
3BaSO4(s) . What is the...
asked 10 months ago -
Suppose that Savneet is considering increasing her
recent random sample from 20 car rentals to 40...
asked 10 months ago -
Trucks arrive at an unloading terminal at an average rate of 120
per hour.
Trucks arrive...
asked 10 months ago -
Why are methanol and ethanol completely soluble in water while
octanol is not very little soluble....
asked 10 months ago -
A facilities manager at a university reads in a research report
that the mean amount of...
asked 10 months ago -
When the CuSO4 is rehydrated by adding water to the anhydrous
compound, is this an endothermic...
asked 10 months ago -
A ray of sunlight is passing from diamond into crown glass; the
angle of incidence is...
asked 10 months ago -
A block of mass 0.249 kg is placed on top of a light, vertical
spring of...
asked 10 months ago -
how do the kidneys compensate in the presences of acidosis
a) trigger hyperventilate
b) reserve acid...
asked 10 months ago -
Question 501 pts
The rental rate of capital to the firm increases. Which of the
following...
asked 10 months ago