

does this help?

1819747019108 2774027161160 824028 9287790278109
1. An industrial equipment maintenance service keeps track of the number of service calls they receive in different categories by week. For a particular category, the number of calls per week for the last 52 weeks is provided in the table below. Develop a frequency diagram based on this data. [8 points 12 12 12 12 10 12 20 12 10 12 10 16 10 10 2. A food processor makes frozen TV dinners. To control costs and provide a consistent product, the company has established specifications for portion sizes in the dinners. A particular entrée has a portion specification of 113.003.00 grams. A QC tech takes a random sample of 60 dinners from the line and carefully weighs the entrée portion, resulting in the following data Develop a histogram for this data. Comment on what it reveals. [12 points] 112.91 112.17 113.95 112.16 114.26 114.19 114.53 112.72 113.49 114.23 113.58 112.48 114.84 112.02 114.56 112.79 112.87 111.80 112.36 114.41 114.32 114.59 113.79 112.78 114.45 113.44 114.42 114.22 114.51 114.39 113.94 112.03 114.40 113.54 114.38 113.12 114.90 112.35 112.68 113.45 113.50 114.89 113.74 113.34 111.91 13.75 115.13 112.13 114.17 111.90 114.28 112.60 113.0 112.69 114.04 112.49 113.51 113.31 114.68 112.80
Homework Answers
1) This is a single-valued discrete value ranging from possible values of 7 to 20.
We can make a frequency distribution table first.
For that, we simply count the number of times each value occurs and list it in a tabular form as below.
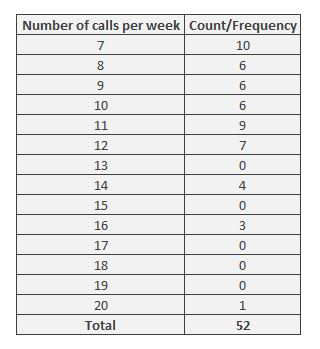
Then we put it in a frequency diagram as follows with the number of calls per week in the x-axis and the counts in the y-axis.

2) The data type here is continuous, so we have to make the histogram with intervals.
Number of observations = 60.
First decide the number of class intervals that you are going to have in the histogram.
As a rule of thumb, it is the square root of the number of
observations (rounded up). So, 
Let's round it up to 8. So, the number of class intervals = 8
Next, determine the range i.e. difference of maximum and minimum values in the data.
Range = 115.13-111.8 = 3.33
Next, width of the class interval (interval class width) = Range/Number of class intervals = 3.33/8 = 0.42
So, our classes will be as follows:
Classes
111.80-112.21
112.22-112.63
112.64-113.05
113.06-113.47
113.48-113.89
113.90-114.31
114.32-114.73
114.74-115.15
Note that, the class width i.e. 0.42 is the difference between the
lower limits of consecutive classes or the upper limits of
consecutive classes. It is NOT the difference between upper limit
and lower limit of the same class.
Now, the next job is to count the number of observations that fall in each class.
This will give the frequency distribution table:

Plotting these into a graph with the classes in the x-axis and frequency/counts in the y-axis, we have the histogram:

Allowed portion specification = 113-3 to 113+3 grams = 110 to 116 grams.
From the histogram, we can see that all of the portions measured conform to the specifications. We can also see from the histogram that majority of the portion weights are more than 113 grams. The most common range for the portion weight is 114.32 grams to 114.73 grams where there are 12 observations (20% of the total observations).
Add Answer to:
112.91113.58114.32 113.94113.50 11.28 112.17 113.95 112.16 114.26 114.19 114.53 112.72 113.49 114...
Most questions answered within 3 hours.
-
Where is the error in this code sequence?
String s1 = "Hello";
String s2 = "ello";...
asked 11 months ago -
Financial data for Joel de Paris, Inc., for last year
follow:
Joel de Paris, Inc.
Balance...
asked 11 months ago -
Consider this reaction:
Al2(SO4)3 (aq)+ BaCl3
(aq) Al2Cl6 (aq)- +
3BaSO4(s) . What is the...
asked 11 months ago -
Suppose that Savneet is considering increasing her
recent random sample from 20 car rentals to 40...
asked 11 months ago -
Trucks arrive at an unloading terminal at an average rate of 120
per hour.
Trucks arrive...
asked 11 months ago -
Why are methanol and ethanol completely soluble in water while
octanol is not very little soluble....
asked 11 months ago -
A facilities manager at a university reads in a research report
that the mean amount of...
asked 11 months ago -
When the CuSO4 is rehydrated by adding water to the anhydrous
compound, is this an endothermic...
asked 11 months ago -
A ray of sunlight is passing from diamond into crown glass; the
angle of incidence is...
asked 11 months ago -
A block of mass 0.249 kg is placed on top of a light, vertical
spring of...
asked 11 months ago -
how do the kidneys compensate in the presences of acidosis
a) trigger hyperventilate
b) reserve acid...
asked 11 months ago -
Question 501 pts
The rental rate of capital to the firm increases. Which of the
following...
asked 11 months ago