ANSWER THE QUESTIONS IN THE PHOTO BELOW

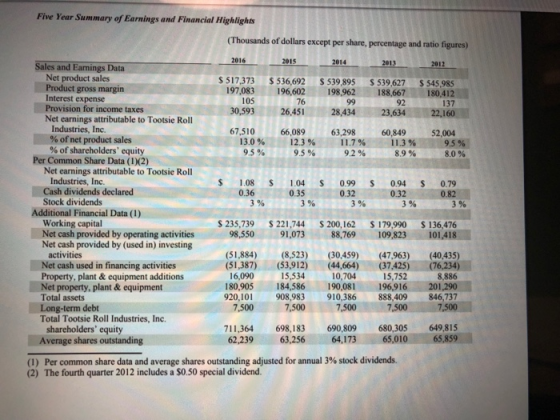


Five Year Summary of Earnings and Financial Highlights (Thousands of dollars except per share, percentage and ratio figures) 2016 2015 2014 2013 201 Sales and Eamings Data Net product sales Product gross margin Interest expense Provision for income taxes Net earnings attributable to Tootsie Roll 517,373 $ 536,692 $ 539,895 $ 539,627 $ 545,985 197,083 196,602198,962188,667180,412 137 30,593 26,451 28,434 23,634 22,160 105 76 92 Industries, Inc 67,510% 6612 9 % 63298 % 60843 % 52,004 % of net product sales % of shareholders' equity Per Common Share Data (1(2) 13.0 % 9.5 % 12.3 % 9.5 % 11.7 % 9.2 % 11.3% 8.9% 95%1 8.0 % Net earnings attributable to Tootsie Roll Industries, Inc Cash dividends declared Stock dividends $ 1.08 $ 1.04 0.99 S 0.94 0.32 0.79 0.82 0.36 0.35 0.32 3% 3% 3 % Additional Financial Data (1) Working capital Net cash provided by operating activities98,550 Net cash provided by (used in) investing s 235,739 S 221,744 $ 200,162 $ 179,990 $ 136,476 88,769 109,823 101,418 91,073 activities Net cash used in financing activities Property, plant & equipment additions (51,884) (8,523) (30,459) (47,963) (40,435) (51,387) (53,912 (44,664) (37,425) (76,234) 8,886 180,905 184,586 190,081 196,916201,290 920,101 908,983 910,386 888,409 846,737 7,500 16,090 10,704 15,752 et property, plant&equipment Total assets Long-term debt Total Tootsie Roll Industries, Inc 7,500 7,500 7,500 7,500 shareholders' equity Average shares outstanding 711,364 698,183 690,809 680,305 649,815 62,239 63,256 64,173 65,010 65,859 (1) Per common share data and average shares outstanding adjusted for annual 3% stock dividends. (2) The fourth quarter 2012 includes a S0.50 special dividend.
of the Company's Notes to Consolidated Financial Statements. Shareholders' equity increased from $698,183 at December 31, 2015 to $711,364 as of December 31, 2016, principally reflecting 2016 net earnings of $67,510, less cash dividends of $22,266, share repurchases of $29,093, and an increase in accumulated other comprehensive loss, primarily foreign translation, of $2,882 during 2016. The Company has a relatively straight-forward financial structure and has historically maintained a conservative financial
CONSOLIDATED STATEMENTS OF Earnings and Retained Earnings TOOTSIE ROLL INDUSTRIES, INC. AND SUBSIDIARIES (in thousands except per share data) Net prodduct sales Rental and royalty revenue Total revenue 320,290 340,090 340,933 947 321 309 340979341.880 Product cost of goods sold 889 Rental and royalty cost Total costs 196,602 198,962 197,083 08 Product gross margin Rental and royaity gross margin 13 Total gross margin Selling, marketing and administrative expenses Earnings from operations Other income, net Earnings before income taxes Provision for income taxes 107 377 108,051 117722 4 91.082 28.434 438) 66,089 S 63,298 Less: Net earnings (loss) attributable to noncontrolling Net earnings attributable to Tootsie Roll Industries, Inc. per share Average number of shares outstanding S 1.08 S 1.04 s 0.99 62.239 63,256 64.173 52,349 $ 64,927 $ 73,109 Retained earnings at beginning of period 66,08963,298 Net earnings a sh dividends Stock dividends (22,209) (21,308) (19,199) (53,817)(57,359) (52,281 S 43,833 S 52,349 S 64,927 Retained earnings at end of period (The accompanying notes are an integral part of these statements.)
Selected Financial Data. Five Year Summary of Earnings and Financial Highlights (Thousands of dollars exce 2016 2015 Sales and Earnings Data $ 517,373 $ 536,692 s Net product sales Product gross margin Interest expense Provision for income taxes 197,083 196,60 105 30,593 26,451 Net earnings attributable to Tootsie Roll Industries, Inc. 67,510 66,089 % of net product sales 13.0 % 95% 12.3 % 95% % of shareholders' equity Per Common Share Data (I)(2) Net earnings attributable to Tootsie Roll Industries, Inc. Cash dividends declared Stock dividends S 1.08 S 1.04 S 0.36 0.35 3% Additional Financial Data (1) Working capital Net cash provided by operating activities Net cash provided by (used in) investing S 235,739 221,744 S 98,550 91,073 activities Net cash used in financing activities Property, plant&equipment additions Net property, plant & equipment Total assets Long-term debt Total Tootsie Roll Industries, Inc. (51,884) (8,523) (51,387) (53,912) 15,534 180,905 184,586 920,101 908,983 7,500 16,090 7,500 shareholders' equity Average shares outstanding 711,364 698,183 62,239 63,256 (1) Per common share data and average shares outstanding adjusted for annu (2) The fourth quarter 2012 includes a $0.50 special dividend.
CONSOLIDATED STATEMENTS OF Cash Flows TOOTSIE ROLL INDUSTRIES, INC. AND SUBSIDIARIES ended December 3 ASH FLOWS FROM OPERATING ACTIVITIES: 67319 S 66,127 S Adjustments to reconcile net earnings to net cash provided by operating activities: 19,627 20,388 255 Depreciation Deferred income taxes Net loss on step acquisition Amortization of marketable security premiums Changes in operating assets and liabilities 199 2,830 3,105 (8,929) 1,119 7,530 11,593 3,839 Accounts receivable 6,869 Other receivables 4,183 2,999 (2,061) (5,797) (1,216) 3,125 Inventories Prepaid expenses and other assets Accounts payable and accrued liabilities (115) Income taxes payable (903) Postretirement health care benefits 12,936 Deferred compensation and other liabilities Net cash provided by operating activities 98,550 91,073 CASH FLOWS FROM INVESTING ACTIVITIES Net cash acquired in step acquisition Change in restricted cash Capital expenditures Purchases of trading securities Sales of trading securities Purchase of available for sale securities Sale and maturity of available for sale securities Net cash used in investing activities ,149 (16,090)(15,534) 4,569) (4,095) 6,644 (81,835) (61,951) 49,177 (29,093)(33,004 (22,266) (20,775 13 (53,91 CASH FLOWS FROM FINANCING ACTIVITIES Shares purchased and retired Dividends paid in cash Proceeds from bank loans Repayment of bank loans Net cash used in financing activities 2,760 2.788 51,387 Effect of exchange rate changes on cash 7,000 Increase (decrease) in cash and cash equivalents Cash and cash equivalents at beginning of year Cash and cash equivalents at end of year 126,145 100 S 119,145 S 126 S 36,365 S 34 S S 61,671 S Supplemental cash flow information: Income taxes paid Interest paid Stock dividend issued The accompanying notes are an integral part of these statements.)
Homework Answers
Explanation to Question 1:
TOOTSIE ROLL INDUSTRIES INC. has presented its consolidated financials for the year 2016 and the past years. The consolidated financials are prepared by combining the financial statements of the holding company and its subsidiaries. A subsidiary company is a company whose equity shares are majorly held by another company (called the holding company). Accordingly, in this case, TOOTSIE ROLL INDUSTRIES INC. would be the holding company who owns the majority shares of various other subsidiary companies.
The shares of the subsidiary company can 100% be held by the holding company or a certain percentage of the minority stake can be held by a third party (who is known to be having a non-controlling interest in the subsidiary company). A party having non-controlling interest in a company has a minority stake in the company with no control over the decisions.
While consolidating the financials of the subsidiaries with the holding company, the % of profit share of the subsidiary companies attributable to the minority stake is deducted from the combined financials. This amount is deducted because that portion of profit/(loss) of the subsidiary company does not belong to the holding company.
In the case of this company, financials of one of the subsidiaries that is being consolidated may be incurring losses. While combining the financials of the subsidiary with the holding company, the entire loss has initially being accounted in the books of Tootsie Roll Industries Inc. Later, the portion of loss that is attributable to the non-controlling interest is deducted from the total loss initially booked in the holding company (Tootsie Roll Industries Inc.). Accordingly, since the net loss booked in the holding company is reduced by $191,000, the amount of profit transferred to the retained earnings account has increased from $67,319,000 (which includes the total loss accounted of the subsidiary) to $67,510,000.
Explanation to Question 2:
From the portions provided, it is understood that explanation is sought only for the first question asked since the second question mentions about explaining the linkage between four statements while only the income statement and cash flow statement portion is being posted.
Add Answer to:
For the year ended December 31, 2016, Tootsie Roll Industries reported net earmings of $67,319 th...
The 2017 Annual Report of Tootsie Roll Industries contains the following information. (in millions) December 31,...
The 2017 Annual Report of Tootsie Roll Industries contains the following information. (in millions) December 31, 2017 December 31, 2016 Total assets $930.9 $920.1 Total liabilities 197.1 208.6 Net sales 515.7 517.4 Net income 80.7 67.2 Compute the following ratios for Tootsie Roll for 2017. (a) Asset turnover (Round answer to 3 decimal places, e.g. 0.851 times.) enter the asset turnover rounded to 4 decimal places ?times (b) Return on assets (Round answer to 2 decimal places, e.g. 4.87%.) enter...
What was total net sales for the year ended December 30, 2017? What are the main...
 What was total net sales for the year ended December 30,
2017?
What are the main types of expenses for Kellogg?
What was net income for the year ended December 30, 2017?
What are the two largest assets?
What are the two largest liabilities?
What is the value of stockholders’ equity?
Where in this annual report can you learn more about Kellogg’s
specific Accounting Policies?
When does Kellogg recognize sales revenue?
TEM 8.FINANCIAL STATEMENTS AND SUPPLEMENTARY DATA Kellogg Company and...
What was total net sales for the year ended December 30,
2017?
What are the main types of expenses for Kellogg?
What was net income for the year ended December 30, 2017?
What are the two largest assets?
What are the two largest liabilities?
What is the value of stockholders’ equity?
Where in this annual report can you learn more about Kellogg’s
specific Accounting Policies?
When does Kellogg recognize sales revenue?
TEM 8.FINANCIAL STATEMENTS AND SUPPLEMENTARY DATA Kellogg Company and...
Tootsie Roll Industries manufactures and sells more than 64 million Tootsie Rolls each day. The following...
 Tootsie Roll Industries manufactures and sells more than 64 million Tootsie Rolls each day. The following items were listed on Tootsie Roll's recent income statement and balance sheet. For each item, select (1) the type of account and (2) whether it is reported on the income statement (V/S) or balance sheet (B/s (1) Type (2) Statement Asset Expense Asset Asset Expense Revenue Liability Stockholders' Equity Liability 1. Accounts Receivable 2 Office Expenses 3. Cash 5. Advertising Expense 6. Sales Revenue...
PART THREE: At the end of December 31, 2022, the shareholder's equity was as follows for...
 PART THREE: At the end of December 31, 2022, the shareholder's equity was as follows for ABZ Inc.: $755,000 $2 Preferred Shares (37,500 shares issued and outstanding; cumulative, nonparticipating, and convertible into two common shares for each preferred share Common Shares (100,000 shares issued and outstanding) Retained Earnings AOCI: OCI unrealized gains from investments Total Shareholders' Equity 500,000 1,500,000 80,000 $2,835,000 Earnings for 2021 had been $725,000 which includes the comprehensive income of $120,500 from an unrealized gain on an...
Refer to the financial statements of The Home Depot in Appendix A. (Note: Fiscal 2016 for...
 Refer to the financial statements of The Home Depot in Appendix
A. (Note: Fiscal 2016 for The Home Depot runs from February 1,
2016, to January 29, 2017. As with many retail companies, The Home
Depot labels the period “Fiscal 2016” even though it ends in the
2017 calendar year. The label “Fiscal 2016” is appropriate because
Fiscal 2016 includes 11 months from the 2016 calendar year. The
Home Depot explains its choice of fiscal period in Note 1 to...
Refer to the financial statements of The Home Depot in Appendix
A. (Note: Fiscal 2016 for The Home Depot runs from February 1,
2016, to January 29, 2017. As with many retail companies, The Home
Depot labels the period “Fiscal 2016” even though it ends in the
2017 calendar year. The label “Fiscal 2016” is appropriate because
Fiscal 2016 includes 11 months from the 2016 calendar year. The
Home Depot explains its choice of fiscal period in Note 1 to...
Information from the financial statements of Henderson-Niles Industries included the following at December 31, 2016: Common...
Information from the financial statements of Henderson-Niles Industries included the following at December 31, 2016: Common shares outstanding throughout the year 100 million Convertible preferred shares (convertible into 40 million shares of common) 75 million Convertible 10% bonds (convertible into 15.0 million shares of common) $ 1,200 million Henderson-Niles’ net income for the year ended December 31, 2016, is $640 million. The income tax rate is 40%. Henderson-Niles paid dividends of $2 per share on its preferred stock during 2016....
Question 6 Loki Corporation earned net income of $90,000 during the year ended December 31 2016....
Question 6 Loki Corporation earned net income of $90,000 during the year ended December 31 2016. On December 15, Loki had declared the annual cash dividend on its $0.35 preferred shares (5,000 shares issued for $80,000) and a $0.40 per share cash dividend on its common shares (20,000 shares issued for $60,000). Loki then paid the dividends on January 4, 2017. Journalize the following for Loki Corporation: Declaring the cash dividends on December 15, 2016. Paying the...
The financial statements for Delta Industries for the year ended December 31st, 2018 are as follows:...
The financial statements for Delta Industries for the year ended December 31st, 2018 are as follows: Delta Industries Statement of Income For the years ended December 31, 2018 and 2017 2018 2017 Sales revenue $351,500 $310,000 Cost of goods sold 201,000 155,000 Gross margin 150,500 155,000 Operating expenses: 65,000 71,000 Operating income 85,500 84,000 Interest expense 26,000 20,000 Income before income tax 59,500 64,000 Income tax expense 19,000 22,500 Operating income $40,500 $41,500 Delta Industries Statement of Financial Position December...
Comprehensive Problem (Chapter 2) Extreme Edge Ine. Income Statements For the Year Ended December 31 Sales...
 Comprehensive Problem (Chapter 2) Extreme Edge Ine. Income Statements For the Year Ended December 31 Sales revenues 2015 2014 S 1,310 1,240 Cost of goods sold Gross profit Depreciation expense 510 136 369 521 120 341 Income from continuing operations Financial (interest) expense Income tax expense (benefit) Net income (loss) 24 0.48 Earnings (loss) per share Statements of Shareholders' Equity (in thousands, except par value) Balance as of January 1, 2014 Common stock issued, $1 par value Net income Dividends...
Presented below are the financial statements of Coronado Industries. Coronado Industries Comparative Balance Sheets December 31...
 Presented below are the financial statements of Coronado Industries. Coronado Industries Comparative Balance Sheets December 31 Assets 2022 $ 49,000 2021 $28,000 Cash Accounts receivable Inventory Property, plant, and equipment 28,000 39,200 84,000 (44,800) $155,400 19,600 28,000 109,200 (33,600) $151,200 Accumulated depreciation Total Liabilities and Stockholders' Equity Accounts payable Income taxes payable $ 26,600 9,800 23,800 25,200 Bonds payable $ 21,000 11,200 46,200 19,600 53,200 $151,200 Common stock Retained earnings 70,000 Total $155,400 Coronado Industries Income Statement For the Year...
 What was total net sales for the year ended December 30,
2017?
What are the main types of expenses for Kellogg?
What was net income for the year ended December 30, 2017?
What are the two largest assets?
What are the two largest liabilities?
What is the value of stockholders’ equity?
Where in this annual report can you learn more about Kellogg’s
specific Accounting Policies?
When does Kellogg recognize sales revenue?
TEM 8.FINANCIAL STATEMENTS AND SUPPLEMENTARY DATA Kellogg Company and...
What was total net sales for the year ended December 30,
2017?
What are the main types of expenses for Kellogg?
What was net income for the year ended December 30, 2017?
What are the two largest assets?
What are the two largest liabilities?
What is the value of stockholders’ equity?
Where in this annual report can you learn more about Kellogg’s
specific Accounting Policies?
When does Kellogg recognize sales revenue?
TEM 8.FINANCIAL STATEMENTS AND SUPPLEMENTARY DATA Kellogg Company and...
 Tootsie Roll Industries manufactures and sells more than 64 million Tootsie Rolls each day. The following items were listed on Tootsie Roll's recent income statement and balance sheet. For each item, select (1) the type of account and (2) whether it is reported on the income statement (V/S) or balance sheet (B/s (1) Type (2) Statement Asset Expense Asset Asset Expense Revenue Liability Stockholders' Equity Liability 1. Accounts Receivable 2 Office Expenses 3. Cash 5. Advertising Expense 6. Sales Revenue...
 PART THREE: At the end of December 31, 2022, the shareholder's equity was as follows for ABZ Inc.: $755,000 $2 Preferred Shares (37,500 shares issued and outstanding; cumulative, nonparticipating, and convertible into two common shares for each preferred share Common Shares (100,000 shares issued and outstanding) Retained Earnings AOCI: OCI unrealized gains from investments Total Shareholders' Equity 500,000 1,500,000 80,000 $2,835,000 Earnings for 2021 had been $725,000 which includes the comprehensive income of $120,500 from an unrealized gain on an...
 Refer to the financial statements of The Home Depot in Appendix
A. (Note: Fiscal 2016 for The Home Depot runs from February 1,
2016, to January 29, 2017. As with many retail companies, The Home
Depot labels the period “Fiscal 2016” even though it ends in the
2017 calendar year. The label “Fiscal 2016” is appropriate because
Fiscal 2016 includes 11 months from the 2016 calendar year. The
Home Depot explains its choice of fiscal period in Note 1 to...
Refer to the financial statements of The Home Depot in Appendix
A. (Note: Fiscal 2016 for The Home Depot runs from February 1,
2016, to January 29, 2017. As with many retail companies, The Home
Depot labels the period “Fiscal 2016” even though it ends in the
2017 calendar year. The label “Fiscal 2016” is appropriate because
Fiscal 2016 includes 11 months from the 2016 calendar year. The
Home Depot explains its choice of fiscal period in Note 1 to...
 Comprehensive Problem (Chapter 2) Extreme Edge Ine. Income Statements For the Year Ended December 31 Sales revenues 2015 2014 S 1,310 1,240 Cost of goods sold Gross profit Depreciation expense 510 136 369 521 120 341 Income from continuing operations Financial (interest) expense Income tax expense (benefit) Net income (loss) 24 0.48 Earnings (loss) per share Statements of Shareholders' Equity (in thousands, except par value) Balance as of January 1, 2014 Common stock issued, $1 par value Net income Dividends...
 Presented below are the financial statements of Coronado Industries. Coronado Industries Comparative Balance Sheets December 31 Assets 2022 $ 49,000 2021 $28,000 Cash Accounts receivable Inventory Property, plant, and equipment 28,000 39,200 84,000 (44,800) $155,400 19,600 28,000 109,200 (33,600) $151,200 Accumulated depreciation Total Liabilities and Stockholders' Equity Accounts payable Income taxes payable $ 26,600 9,800 23,800 25,200 Bonds payable $ 21,000 11,200 46,200 19,600 53,200 $151,200 Common stock Retained earnings 70,000 Total $155,400 Coronado Industries Income Statement For the Year...
Most questions answered within 3 hours.
-
Where is the error in this code sequence?
String s1 = "Hello";
String s2 = "ello";...
asked 11 months ago -
Financial data for Joel de Paris, Inc., for last year
follow:
Joel de Paris, Inc.
Balance...
asked 11 months ago -
Consider this reaction:
Al2(SO4)3 (aq)+ BaCl3
(aq) Al2Cl6 (aq)- +
3BaSO4(s) . What is the...
asked 11 months ago -
Suppose that Savneet is considering increasing her
recent random sample from 20 car rentals to 40...
asked 11 months ago -
Trucks arrive at an unloading terminal at an average rate of 120
per hour.
Trucks arrive...
asked 11 months ago -
Why are methanol and ethanol completely soluble in water while
octanol is not very little soluble....
asked 11 months ago -
A facilities manager at a university reads in a research report
that the mean amount of...
asked 11 months ago -
When the CuSO4 is rehydrated by adding water to the anhydrous
compound, is this an endothermic...
asked 11 months ago -
A ray of sunlight is passing from diamond into crown glass; the
angle of incidence is...
asked 11 months ago -
A block of mass 0.249 kg is placed on top of a light, vertical
spring of...
asked 11 months ago -
how do the kidneys compensate in the presences of acidosis
a) trigger hyperventilate
b) reserve acid...
asked 11 months ago -
Question 501 pts
The rental rate of capital to the firm increases. Which of the
following...
asked 11 months ago