
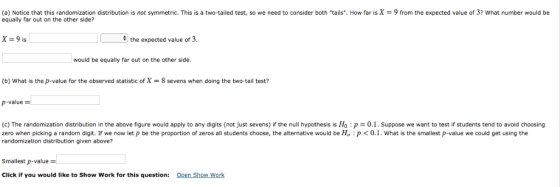
(a) Notice that this randomization distribution is not symmetric. This is a two-tailed test, so we need to consider both "tails. How far is X -9 from the expected value of 3? What number would be equally far out on the other side? the expected value of 3 would be equally far out on the other side (b) What is the p-value for the observed statistic of X-8 sevens when doing the two-tail test? -value- (c) The randomization distribution in the above figure would apply to any digits (not just sevens) if the null hypothesis is H0 : p = 0.1 . Suppose we want to test if students tend to avoid choosing zero when picking a random digit. If we now let p be the proportion of zeros all students choose, the alternative would be Ha P
Homework Answers
ANS ::-
AS FOR GIVEN DATA...
(A)
X=8 is -1 (2-3) above the expected value of 3.
0 would be equally for out on the other side.
(B)
The observed static of X=8 seven is 2+1 =3 of the 1000 simulation. Notice that this randomization distribution is not symmetric. This is a two-tailed test, so we need to consider both “tails”. The p-value for a two-tailed test is double of a one-tail test.
Hence, p-value for a two-tailed test = 2(3/1000) = 0.006
AS FOR HOMEWORKLIB RULES WE ANSWER ONE QUESTION ONLY...
Add Answer to:
Chapter 4, Section 2, Exercise 079 Thirty students are asked to choose a random number between 0 ...
Chapter 4, Section 2, Exercise 079 What is your lucky number? Thirty students are asked to...
 Chapter 4, Section 2, Exercise 079 What is your lucky number? Thirty students are asked to choose a random number between and inclusive, to create a data set of n = digits. If the numbers are truly random, we would expect about 3 zeros 3 ones, 3 twos, and so on. If the data set includes 8 sevens, how unusual is that? If we look exclusively at the number of sevens, we expect the proportion of sevens to be 0.1...
Chapter 9 The 94 students in a statistics class are categorized by gender and by the year in school. The numbers obtained are displayed belovw Year in school Gender Freshman Sophomore Junior Senior G...
 Chapter 9 The 94 students in a statistics class are categorized by gender and by the year in school. The numbers obtained are displayed belovw Year in school Gender Freshman Sophomore Junior Senior Graduate Total Male Female Total 31 63 94 17 17 19 23 24 13 24 Suppose we wish to test the null hypothesis that a student is twice likely to be a female than a male. Under the null: 1. a. What is the expected number of...
A recent study at a local college claimed that the proportion, p. of students who commute...
 A recent study at a local college claimed that the proportion, p. of students who commute more than fifteen miles to school is no more than 20%. If a random sample of 265 students at this college is selected, and it is found that 65 commute more than fifteen miles to school, can we reject the college's claim at the 0.1 level of significance? Perform a one-tailed test. Then fill in the table below. Carry your intermediate computations to at...
A random sample of community college students was asked the number of hours they sleep on...
 A random sample of community college students was asked the number of hours they sleep on a typical week-night during a given academic term. The sample data are as follows: 8 6 4 5 3 7 S 4 3 4 4 5 6 8 7 7 7 3 3 4 What is the 90% confidence interval estimate for the true mean amount of sleep time per night spent by community college students during a academic term? a) The data give...
PRINTER VERSION 4 НАС Chapter 4, Section 2, Exercise 078abcde - MathPad Rolling Dice You roll...
 PRINTER VERSION 4 НАС Chapter 4, Section 2, Exercise 078abcde - MathPad Rolling Dice You roll a die 70 times and record the sample proportion of fives, and you want to test whether the die is biased to give more fives than a fair die would ordinarily give. the p-value for your sample data, you create a randomization distribution of proportions of fives in many simulated samples of size 70 with a fair die. (a) state the null and alternative...
26. In a random sample of 95 college students, 40 wished they would have chosen a...
 26. In a random sample of 95 college students, 40 wished they would have chosen a different major. Use the following steps to construct a 95% confidence interval for the true proportion of all students who wished they would have chosen a different major. a. Find the number of sample values, n b. Find the sample proportion, B c. Find the critical z-score, 2/2 d. When calculated correctly, E = 0.0993. Construct a confidence interval for the population proportion, p....
A presidential candidate's aide estimates that, among all college students, the proportion p who intend to...
 A presidential candidate's aide estimates that, among all college students, the proportion p who intend to vote in the upcoming election is at most 65%. If 194 out of a random sample of 270 college students expressed an intent to vote, can the aide's estimate be rejected at the 0.1 level of significance? Perform a one-tailed test. Then fill in the table below. Carry your intermediate computations to at least three decimal places and round your answers as specified in...
The discrete random variable X is the number of students that show up for Professor Smith's...
 The discrete random variable X is the number of students that show up for Professor Smith's office hours on Monday afternoons. The table below shows the probability distribution for X. What is the expected value ElX) for this distribution? 16 X 123 Total P(x) 48 30 20.1 1.00 Multiple Choice 1.2 10 c Prey 16 of19 İİ Next pe here to search
Chapter 4, Section 2, Exercise 066bd Influencing Voters: Is a Phone Call Better than a Flyer?...
 Chapter 4, Section 2, Exercise 066bd
Influencing Voters: Is a Phone Call Better than a
Flyer?
A study is conducted to investigate whether a recorded phone call
is more effective than a flyer in persuading voters to vote for a
particular candidate. The response variable is the proportion of
voters planning to vote for the candidate, with p1 and p2
representing the proportions for the two methods (receiving a phone
call and receiving a flyer, respectively.) The sample statistic of...
Chapter 4, Section 2, Exercise 066bd
Influencing Voters: Is a Phone Call Better than a
Flyer?
A study is conducted to investigate whether a recorded phone call
is more effective than a flyer in persuading voters to vote for a
particular candidate. The response variable is the proportion of
voters planning to vote for the candidate, with p1 and p2
representing the proportions for the two methods (receiving a phone
call and receiving a flyer, respectively.) The sample statistic of...
At Rio Salado College, it was observed that 30% of the students were still classified as...
At Rio Salado College, it was observed that 30% of the students were still classified as dependents on their parents. However, in the honors program for students, 140 out of 398 students are dependents. The administrators want to know if the proportion of dependent students in the honors program is significantly different from the proportion for the school district. Test at the α=.05α=.05 level of significance. What is the hypothesized population proportion for this test? p=p= (Report answer as a...
 Chapter 4, Section 2, Exercise 079 What is your lucky number? Thirty students are asked to choose a random number between and inclusive, to create a data set of n = digits. If the numbers are truly random, we would expect about 3 zeros 3 ones, 3 twos, and so on. If the data set includes 8 sevens, how unusual is that? If we look exclusively at the number of sevens, we expect the proportion of sevens to be 0.1...
 Chapter 9 The 94 students in a statistics class are categorized by gender and by the year in school. The numbers obtained are displayed belovw Year in school Gender Freshman Sophomore Junior Senior Graduate Total Male Female Total 31 63 94 17 17 19 23 24 13 24 Suppose we wish to test the null hypothesis that a student is twice likely to be a female than a male. Under the null: 1. a. What is the expected number of...
 A recent study at a local college claimed that the proportion, p. of students who commute more than fifteen miles to school is no more than 20%. If a random sample of 265 students at this college is selected, and it is found that 65 commute more than fifteen miles to school, can we reject the college's claim at the 0.1 level of significance? Perform a one-tailed test. Then fill in the table below. Carry your intermediate computations to at...
 A random sample of community college students was asked the number of hours they sleep on a typical week-night during a given academic term. The sample data are as follows: 8 6 4 5 3 7 S 4 3 4 4 5 6 8 7 7 7 3 3 4 What is the 90% confidence interval estimate for the true mean amount of sleep time per night spent by community college students during a academic term? a) The data give...
 PRINTER VERSION 4 НАС Chapter 4, Section 2, Exercise 078abcde - MathPad Rolling Dice You roll a die 70 times and record the sample proportion of fives, and you want to test whether the die is biased to give more fives than a fair die would ordinarily give. the p-value for your sample data, you create a randomization distribution of proportions of fives in many simulated samples of size 70 with a fair die. (a) state the null and alternative...
 26. In a random sample of 95 college students, 40 wished they would have chosen a different major. Use the following steps to construct a 95% confidence interval for the true proportion of all students who wished they would have chosen a different major. a. Find the number of sample values, n b. Find the sample proportion, B c. Find the critical z-score, 2/2 d. When calculated correctly, E = 0.0993. Construct a confidence interval for the population proportion, p....
 A presidential candidate's aide estimates that, among all college students, the proportion p who intend to vote in the upcoming election is at most 65%. If 194 out of a random sample of 270 college students expressed an intent to vote, can the aide's estimate be rejected at the 0.1 level of significance? Perform a one-tailed test. Then fill in the table below. Carry your intermediate computations to at least three decimal places and round your answers as specified in...
 The discrete random variable X is the number of students that show up for Professor Smith's office hours on Monday afternoons. The table below shows the probability distribution for X. What is the expected value ElX) for this distribution? 16 X 123 Total P(x) 48 30 20.1 1.00 Multiple Choice 1.2 10 c Prey 16 of19 İİ Next pe here to search
Most questions answered within 3 hours.
-
Where is the error in this code sequence?
String s1 = "Hello";
String s2 = "ello";...
asked 11 months ago -
Financial data for Joel de Paris, Inc., for last year
follow:
Joel de Paris, Inc.
Balance...
asked 11 months ago -
Consider this reaction:
Al2(SO4)3 (aq)+ BaCl3
(aq) Al2Cl6 (aq)- +
3BaSO4(s) . What is the...
asked 11 months ago -
Suppose that Savneet is considering increasing her
recent random sample from 20 car rentals to 40...
asked 11 months ago -
Trucks arrive at an unloading terminal at an average rate of 120
per hour.
Trucks arrive...
asked 11 months ago -
Why are methanol and ethanol completely soluble in water while
octanol is not very little soluble....
asked 11 months ago -
A facilities manager at a university reads in a research report
that the mean amount of...
asked 11 months ago -
When the CuSO4 is rehydrated by adding water to the anhydrous
compound, is this an endothermic...
asked 11 months ago -
A ray of sunlight is passing from diamond into crown glass; the
angle of incidence is...
asked 11 months ago -
A block of mass 0.249 kg is placed on top of a light, vertical
spring of...
asked 11 months ago -
how do the kidneys compensate in the presences of acidosis
a) trigger hyperventilate
b) reserve acid...
asked 11 months ago -
Question 501 pts
The rental rate of capital to the firm increases. Which of the
following...
asked 11 months ago