


Balance Sheet Feb. 26, 2011 Feb. 27, 2010 (S millions) Cash and cash equivalents Short-term investments Receivables 1,103 1,826 90 2,020 2,348 5,897 1,103 10,473 Merchandise inventories Other current assets Total current assets Property and equipment Land and buildings Leasehold improvements Fixtures and equipment Property under capital lease Gross property and equipment Less accumulated depreciation Net property and equipment 5,486 1,144 10,566 766 2,318 4,701 120 7,905 4,082 3,823 2,454 133 203 328 435 757 2,154 4,447 95 7,453 3,383 4,070 2,452 159 279 324 452 Goodwill Tradenames, Net Customer Relationships, Net Equity and Other Investments Other assets Total assets Liabilities and Equity Accounts payable Unredeemed giftcard liabilities Accrued compensation and related expenses Accrued liabilities Accrued income taxes Short-term debt Current portion of long-term debt Total current liabilities Long-term liabilities Long-term debt $17,84918,302 $4,894 474 570 1,471 256 557 441 8,663 1,183 $5,276 544 1,681 663 35 8,978 1,256 1,104
Homework Answers
| PARTICULARS | Amount in $ | Note | |||
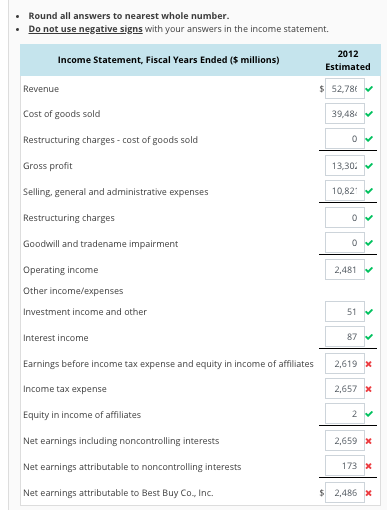
| Revenue | 52780 | 5% revenue growth | |||
| Cost of goods sold | 39480 | 74.8% of revenue | |||
| restructuring charges-COGS | 0 | ||||
| grossprofit | 13302 | 52780-39480 | |||
| Selling General and admin exps | 10821 | 20.5% of revenue | |||
| Rest, Charges | 0 | ||||
| Goodwill and impairment | 0 | ||||
| operating income | 2481 | ||||
| Investment income and other | 51 | ||||
| Interest Expense | (87) | it is an expense and not an income so we will deduct it. | |||
| Earning before Income tax and Equity in income of affiliates | 2445 | 2481+51-87 | answer 1 | ||
| Income tax expense | 841 | 34.4% of 2445 | answer 2 | ||
| Equity in Income of Affiliates | 2 | ||||
| Net earning including non controlling interest | 1606 | (2445+2)-841 | answer 3 | ||
| Net earning attributable to non controlling interest | (105) | 1606*6.5% | |||
| Net earning to best buy inc. | 1501 | 1606-105 | answer 4 | ||
|
NOTE YOUR ANSWERS WENT WRONG BEACUSE YOU ADDED INTEREST EXPENSE OF $87 INSTEAD OF DEDUCTING IT FROM OPERATING INCOME OF $2481. |
|||||
Add Answer to:
Balance Sheet Feb. 26, 2011 Feb. 27, 2010 (S millions) Cash and cash equivalents Short-term inves...
Consolidated Statements of Earnings For Fiscal Years Ended ($ millions) February 26, 2011 February 27, 2010...
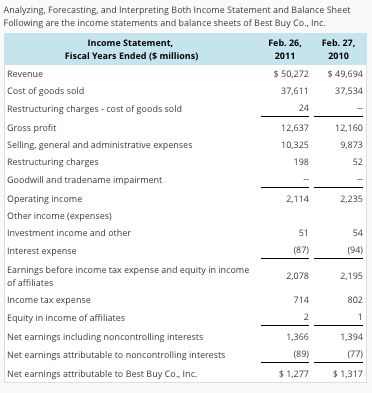
 Consolidated Statements of Earnings For Fiscal Years Ended ($ millions) February 26, 2011 February 27, 2010 February 28, 2009 Revenue 50.272 $ 49,694 $ 45,015 Cost of goods sold 37 611 37,534 34,017 Restructuring charges - cost of goods sold Gross Profit 12,637 12,160 10,998 Selling general and administrative expenses 10.325 9,873 Restructuring charges Goodwill and tradename impairment Operating income 2,235 1,870 Other income (expense) Investment income and other 54 Investment impairment (111) Interest expense (94) Earnings before income tax...
Forecast the Statement of Cash Flows Following are the income statements and balance sheets of Best...
Forecast the Statement of Cash Flows Following are the income statements and balance sheets of Best Buy Co., Inc. Income Statement, Fiscal Years Ended ($ millions) 2012 Estimated Feb. 26, 2011 Revenue $53,037 $50,272 Cost of goods sold 39,672 37,611 Restructuring charges - cost of goods sold -- 24 Gross profit 13,365 12,637 Selling, general and administrative expenses 10,873 10,325 Restructuring charges -- 198 Goodwill and tradename impairment -- -- Operating income 2,492 2,114 Other income (expenses) Investment income and...
MANGO INC. CONSOLIDATED BALANCE SHEET September 30, 2017 (dollars in millions) ASSETS Current assets: Cash Short-term...
 MANGO INC. CONSOLIDATED BALANCE SHEET September 30, 2017 (dollars in millions) ASSETS Current assets: Cash Short-term investments Accounts receivable Inventories Other current assets Total current assets Long-term investments Property, plant, and equipment, net Other noncurrent assets Total assets LIABILITIES AND STOCKHOLDERS' EQUITY Current Liabilities: Accounts payable Accrued expenses Unearned revenue Short-term notes payable Total current liabilities Long-term debt Other noncurrent liabilities Total liabilities Stockholders' equity: Common stock ($0.00001 per value) Additional paid-in capital Retained earnings Total stockholders' equity Total liabilities...
Comparative Balance Sheets Consider the following balance sheet data for Great Buy Co, Inc, an electronics...
 Comparative Balance Sheets Consider the following balance sheet data for Great Buy Co, Inc, an electronics and major appliance retailer, at February 26, 2013 and Februar 27, 2012 (amounts in thousands): Feb. 26, 2013 Feb. 27, 2012 $7,138 37,968 637,950 249,991 9,829 764,610 304,926 172,724 126,442 7,774 $439,142 Cash and Cash Equivalents Accounts Receivables Merchandise Inventories Other Current Assets 59,872 52,944 13,844 Total Current Assets Property and Equipment (net) Other Assets Total Assets 15,160 $952,494 $402,028 $186,005 Current Liabilities We...
MANGO INC. CONSOLIDATED BALANCE SHEET September 30, 2017 (dollars in millions) ASSETS Current assets: Cash Short-term...
 MANGO INC. CONSOLIDATED BALANCE SHEET September 30, 2017 (dollars in millions) ASSETS Current assets: Cash Short-term investments Accounts receivable Inventories Other current assets Total current assets Long-term investments Property, plant, and equipment, net Other noncurrent assets Total assets LIABILITIES AND STOCKHOLDERS' EQUITY Current Liabilities: Accounts payable Accrued expenses Unearned revenue Short-term notes payable Total current liabilities Long-term debt Other noncurrent liabilities Total liabilities Stockholders' equity: Common stock ($0.00001 per value) Additional paid-in capital Retained earnings Total stockholders' equity Total liabilities...
Instead of “cash,” the company’s balance sheet uses the account name “Cash and cash equivalents.” How...
 Instead of “cash,” the company’s balance sheet uses the account
name “Cash and cash equivalents.” How does the company define cash
equivalents?
The annual report has two reports in which management is
clearly identified as having for the company’s financial reporting
and internal controls. What are the names of these reports and on
what pages are they located?
For the Fiscal Year 2017 2016 As Adjusted As Adjusted 71,786 $ 69,414 $ 72,714 70,271 2014 2018 74,433 $ 75,356 $...
Instead of “cash,” the company’s balance sheet uses the account
name “Cash and cash equivalents.” How does the company define cash
equivalents?
The annual report has two reports in which management is
clearly identified as having for the company’s financial reporting
and internal controls. What are the names of these reports and on
what pages are they located?
For the Fiscal Year 2017 2016 As Adjusted As Adjusted 71,786 $ 69,414 $ 72,714 70,271 2014 2018 74,433 $ 75,356 $...
Balance Sheet Assets Fiscal year is January-December. All values USD millions. 2017 Cash & Short Term...
Balance Sheet Assets Fiscal year is January-December. All values USD millions. 2017 Cash & Short Term Investments 18.3B Total Accounts Receivable 13.49B Inventories 8.77B Other Current Assets 2.54B Total Current Assets 43.09B 2017 Net Property, Plant & Equipment 17.01B Total Investments and Advances 751M Long-Term Note Receivable - Intangible Assets 85.13B Other Assets 4.22B Total Assets 157.3B Liabilities & Shareholders' Equity 2017 ST Debt & Current Portion LT Debt 3.91B Accounts Payable 7.31B Income Tax Payable 1.85B Other Current Liabilities...
1. Determine the missing amounts. 2. Prepare Trident's classified balance sheet. Complete this question by entering...
 1. Determine the missing amounts. 2. Prepare Trident's classified balance sheet. Complete this question by entering your answers in the tabs bel Required 1 Required 2 Determine the missing amounts. (Enter the answers in thousands of dolla ($ in 000s) $ 239,186 353,700 504,944 Cash and cash equivalents Short-term investments Accounts receivable Inventory Prepaid expenses (current) Total current assets Long-term receivables Equipment (net) 83,259 1,594,927 110,800 Total assets 31,116 Notes payable (current) Accounts payable Accrued liabilities Other current liabilities Total...
The following balance sheet information (in $ millions) comes from the Annual Report to Shareholders of...
 The following balance sheet information (in $ millions) comes
from the Annual Report to Shareholders of Hotel California for the
2013 fiscal year. (Certain amounts have been replaced with question
marks to test your understanding of balance sheets.) In addition,
you’re provided with the following information from an analysis of
Hotel California’s financial position at the same date:
Current ratio = 4.78
Acid-test ratio = 0.968
Debt-to-equity ratio = 1.35
Compute the missing amounts (rounded to the nearest $ in...
The following balance sheet information (in $ millions) comes
from the Annual Report to Shareholders of Hotel California for the
2013 fiscal year. (Certain amounts have been replaced with question
marks to test your understanding of balance sheets.) In addition,
you’re provided with the following information from an analysis of
Hotel California’s financial position at the same date:
Current ratio = 4.78
Acid-test ratio = 0.968
Debt-to-equity ratio = 1.35
Compute the missing amounts (rounded to the nearest $ in...
Prepare a classified balance sheet ignoring monetary amounts. We were unable to transcribe this imageLess: Accumulated...
 Prepare a classified balance sheet ignoring monetary
amounts.
We were unable to transcribe this imageLess: Accumulated depreciation-equipment Net property, plant, and equipment Intangible assets Copyright Patent Total intangible assets Total assets Liabilities and Shareholders' Equity Current liabilities Notes payable Wages payable Accounts payable Rent payable Taxes payable Total current liabilities Long-term liabilities Bonds payable Notes payable Total current liabilities Shareholders' equity Preferred stock Common stock Retained earnings Total liabilities and shareholders' equity Name of Company Balance Sheet At [date] Assets...
Prepare a classified balance sheet ignoring monetary
amounts.
We were unable to transcribe this imageLess: Accumulated depreciation-equipment Net property, plant, and equipment Intangible assets Copyright Patent Total intangible assets Total assets Liabilities and Shareholders' Equity Current liabilities Notes payable Wages payable Accounts payable Rent payable Taxes payable Total current liabilities Long-term liabilities Bonds payable Notes payable Total current liabilities Shareholders' equity Preferred stock Common stock Retained earnings Total liabilities and shareholders' equity Name of Company Balance Sheet At [date] Assets...
 Consolidated Statements of Earnings For Fiscal Years Ended ($ millions) February 26, 2011 February 27, 2010 February 28, 2009 Revenue 50.272 $ 49,694 $ 45,015 Cost of goods sold 37 611 37,534 34,017 Restructuring charges - cost of goods sold Gross Profit 12,637 12,160 10,998 Selling general and administrative expenses 10.325 9,873 Restructuring charges Goodwill and tradename impairment Operating income 2,235 1,870 Other income (expense) Investment income and other 54 Investment impairment (111) Interest expense (94) Earnings before income tax...
 MANGO INC. CONSOLIDATED BALANCE SHEET September 30, 2017 (dollars in millions) ASSETS Current assets: Cash Short-term investments Accounts receivable Inventories Other current assets Total current assets Long-term investments Property, plant, and equipment, net Other noncurrent assets Total assets LIABILITIES AND STOCKHOLDERS' EQUITY Current Liabilities: Accounts payable Accrued expenses Unearned revenue Short-term notes payable Total current liabilities Long-term debt Other noncurrent liabilities Total liabilities Stockholders' equity: Common stock ($0.00001 per value) Additional paid-in capital Retained earnings Total stockholders' equity Total liabilities...
 Comparative Balance Sheets Consider the following balance sheet data for Great Buy Co, Inc, an electronics and major appliance retailer, at February 26, 2013 and Februar 27, 2012 (amounts in thousands): Feb. 26, 2013 Feb. 27, 2012 $7,138 37,968 637,950 249,991 9,829 764,610 304,926 172,724 126,442 7,774 $439,142 Cash and Cash Equivalents Accounts Receivables Merchandise Inventories Other Current Assets 59,872 52,944 13,844 Total Current Assets Property and Equipment (net) Other Assets Total Assets 15,160 $952,494 $402,028 $186,005 Current Liabilities We...
 MANGO INC. CONSOLIDATED BALANCE SHEET September 30, 2017 (dollars in millions) ASSETS Current assets: Cash Short-term investments Accounts receivable Inventories Other current assets Total current assets Long-term investments Property, plant, and equipment, net Other noncurrent assets Total assets LIABILITIES AND STOCKHOLDERS' EQUITY Current Liabilities: Accounts payable Accrued expenses Unearned revenue Short-term notes payable Total current liabilities Long-term debt Other noncurrent liabilities Total liabilities Stockholders' equity: Common stock ($0.00001 per value) Additional paid-in capital Retained earnings Total stockholders' equity Total liabilities...
 Instead of “cash,” the company’s balance sheet uses the account
name “Cash and cash equivalents.” How does the company define cash
equivalents?
The annual report has two reports in which management is
clearly identified as having for the company’s financial reporting
and internal controls. What are the names of these reports and on
what pages are they located?
For the Fiscal Year 2017 2016 As Adjusted As Adjusted 71,786 $ 69,414 $ 72,714 70,271 2014 2018 74,433 $ 75,356 $...
Instead of “cash,” the company’s balance sheet uses the account
name “Cash and cash equivalents.” How does the company define cash
equivalents?
The annual report has two reports in which management is
clearly identified as having for the company’s financial reporting
and internal controls. What are the names of these reports and on
what pages are they located?
For the Fiscal Year 2017 2016 As Adjusted As Adjusted 71,786 $ 69,414 $ 72,714 70,271 2014 2018 74,433 $ 75,356 $...
 1. Determine the missing amounts. 2. Prepare Trident's classified balance sheet. Complete this question by entering your answers in the tabs bel Required 1 Required 2 Determine the missing amounts. (Enter the answers in thousands of dolla ($ in 000s) $ 239,186 353,700 504,944 Cash and cash equivalents Short-term investments Accounts receivable Inventory Prepaid expenses (current) Total current assets Long-term receivables Equipment (net) 83,259 1,594,927 110,800 Total assets 31,116 Notes payable (current) Accounts payable Accrued liabilities Other current liabilities Total...
 The following balance sheet information (in $ millions) comes
from the Annual Report to Shareholders of Hotel California for the
2013 fiscal year. (Certain amounts have been replaced with question
marks to test your understanding of balance sheets.) In addition,
you’re provided with the following information from an analysis of
Hotel California’s financial position at the same date:
Current ratio = 4.78
Acid-test ratio = 0.968
Debt-to-equity ratio = 1.35
Compute the missing amounts (rounded to the nearest $ in...
The following balance sheet information (in $ millions) comes
from the Annual Report to Shareholders of Hotel California for the
2013 fiscal year. (Certain amounts have been replaced with question
marks to test your understanding of balance sheets.) In addition,
you’re provided with the following information from an analysis of
Hotel California’s financial position at the same date:
Current ratio = 4.78
Acid-test ratio = 0.968
Debt-to-equity ratio = 1.35
Compute the missing amounts (rounded to the nearest $ in...
 Prepare a classified balance sheet ignoring monetary
amounts.
We were unable to transcribe this imageLess: Accumulated depreciation-equipment Net property, plant, and equipment Intangible assets Copyright Patent Total intangible assets Total assets Liabilities and Shareholders' Equity Current liabilities Notes payable Wages payable Accounts payable Rent payable Taxes payable Total current liabilities Long-term liabilities Bonds payable Notes payable Total current liabilities Shareholders' equity Preferred stock Common stock Retained earnings Total liabilities and shareholders' equity Name of Company Balance Sheet At [date] Assets...
Prepare a classified balance sheet ignoring monetary
amounts.
We were unable to transcribe this imageLess: Accumulated depreciation-equipment Net property, plant, and equipment Intangible assets Copyright Patent Total intangible assets Total assets Liabilities and Shareholders' Equity Current liabilities Notes payable Wages payable Accounts payable Rent payable Taxes payable Total current liabilities Long-term liabilities Bonds payable Notes payable Total current liabilities Shareholders' equity Preferred stock Common stock Retained earnings Total liabilities and shareholders' equity Name of Company Balance Sheet At [date] Assets...
Most questions answered within 3 hours.
-
Where is the error in this code sequence?
String s1 = "Hello";
String s2 = "ello";...
asked 11 months ago -
Financial data for Joel de Paris, Inc., for last year
follow:
Joel de Paris, Inc.
Balance...
asked 11 months ago -
Consider this reaction:
Al2(SO4)3 (aq)+ BaCl3
(aq) Al2Cl6 (aq)- +
3BaSO4(s) . What is the...
asked 11 months ago -
Suppose that Savneet is considering increasing her
recent random sample from 20 car rentals to 40...
asked 11 months ago -
Trucks arrive at an unloading terminal at an average rate of 120
per hour.
Trucks arrive...
asked 11 months ago -
Why are methanol and ethanol completely soluble in water while
octanol is not very little soluble....
asked 11 months ago -
A facilities manager at a university reads in a research report
that the mean amount of...
asked 11 months ago -
When the CuSO4 is rehydrated by adding water to the anhydrous
compound, is this an endothermic...
asked 11 months ago -
A ray of sunlight is passing from diamond into crown glass; the
angle of incidence is...
asked 11 months ago -
A block of mass 0.249 kg is placed on top of a light, vertical
spring of...
asked 11 months ago -
how do the kidneys compensate in the presences of acidosis
a) trigger hyperventilate
b) reserve acid...
asked 11 months ago -
Question 501 pts
The rental rate of capital to the firm increases. Which of the
following...
asked 11 months ago