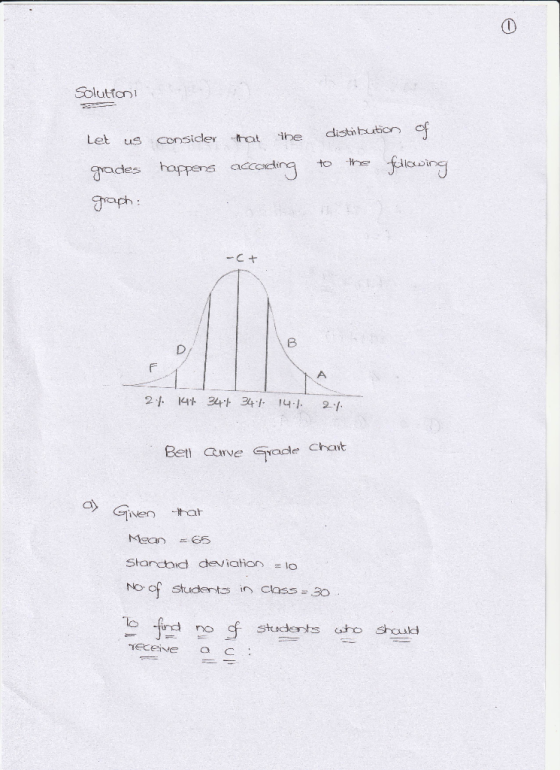
Suppose that, for a certain exam, a teacher grades on a curve. It is known that the mean is 65 and the standard deviation is 10. There are 30 students in the class. (Round your answers to the nearest whole number.)

a) How many students should receive a C?
(b) How many students should receive an A?
Homework Answers

Add Answer to:
Suppose that, for a certain exam, a teacher grades on a curve. It is known that the mean is 65 an...
Suppose that, for a certain exam, a teacher grades on a curve. Frequency 2.2% 2.2% 0.1%...
 Suppose that, for a certain exam, a teacher grades on a curve. Frequency 2.2% 2.2% 0.1% i 34.1% 34.1% 0.1% 13.6% 13.6% M–30 p-20 u-lo 1 p+lo +20 ut30 It is known that the mean is 60 and the standard deviation is 5. There are 55 students in the class. If an exam paper is selected at random, what is the probability that it will be a failing paper? (Round your answer to three decimal places.)
Suppose that, for a certain exam, a teacher grades on a curve. It is known that...
Suppose that, for a certain exam, a teacher grades on a curve. It is known that the mean is 65 and the standard deviation is 10. There are 30 students in the class. What score would be necessary to obtain an A?
Suppose that, for a certain exam, a teacher grades on a curve. Frequency 0.1% 3 4.1% 34.1% 2.2% L 0.1% 13.6% 13.6% M–30...
 Suppose that, for a certain exam, a teacher grades on a curve. Frequency 0.1% 3 4.1% 34.1% 2.2% L 0.1% 13.6% 13.6% M–30 k-20 -lo u+lo u+20 p+30 It is known that the mean is 60 and the standard deviation is 10. There are 35 students in the class. What score would be necessary to obtain an A? or above
The grades on the last science exam had a mean of 89%. Assume the population of...
The grades on the last science exam had a mean of 89%. Assume the population of grades on history exams is known to be distributed Normally, with a standard deviation of 14%. Approximately what percent of students earn a score between 75% and 89%? A. 14% B. 34.1% C. 15.7% D. 38.5% E. 50% When a certain coin is flipped, the probability of obtaining a tails is 0.60. Which of the following is the probability that tails would be obtained...
Grades on a biology exam are approximately normally distributed with a mean of 78 and a...
 Grades on a biology exam are approximately normally distributed with a mean of 78 and a standard deviation of 8. Originally Dr. Smith decides to curve course grades as follows: Students who score above the 90 percentile will receive an A Students whose scores are in the 80-89.percentiles receive a B Students whose scores are in the 70th-795h percentiles receive a C Students whose scores are in the 60-69 percentiles receive a D Students who score below the 60th percentile...
Test grades on the last statistics exam had a mean = 77 and standard deviation =...
 Test grades on the last statistics exam had a mean = 77 and standard deviation = 24 Suppose the teacher decides to curve by subtraction 32 from all scores then doubling the values. If Y represents the new test scores, what is the mean and standard deviation of Y? a) EM-90; ơ--59.2 b) EM = 154;Oy=9.6 c) EM-122; σ-48 EM : 45; σ--27.2 e) None of the above
Suppose that, for a certain mathematics class, the scores are normally distributed with a mean of...
 Suppose that, for a certain mathematics class, the scores are normally distributed with a mean of 75 and a standard deviation of 9. The teacher wishes to give A's to the top 5% of the students and F's to the bottom 5%. The next 15% in either direction will be given B's and D's, with the other students receiving C's. Find the bottom cutoff for receiving an A grade. (You may need to use the standard normal distribution table. Round...
Statistics Grades: The statistics grades in the fall semester had mean of 65. The SRS were...
Statistics Grades: The statistics grades in the fall semester had mean of 65. The SRS were taken from different statistics groups (A, B, C and D) considering that the total number of students that took part on the exam was 110. Assuming that the change in the grades has a normal distribution with standard deviation σ= 10, We computed a 90% confidence interval of the mean change in score μ in the population of all statistics students. A) Find a...
Suppose the mean grade for a statistics midterm exam was 75, with a standard deviation of...
Suppose the mean grade for a statistics midterm exam was 75, with a standard deviation of 10. Assume that your grades were normally distributed. [ 40 pts. Total] a. What percentage of students received at least an 90? [7.5 pts] b. What percentage of students received an 84? [5 pts.] c. What percentage of students received a grade between 60 and 79? [10 pts.] d. What percentage of students received a grade less than 70? [7.5 pts.] e. If 2...
Finn receives a final exam score of 65. The class had a mean of 75 and...
Finn receives a final exam score of 65. The class had a mean of 75 and standard deviation of 10. What percent of students in Finn's class scored lower than him? 84%,50%,34%,16%
 Suppose that, for a certain exam, a teacher grades on a curve. Frequency 2.2% 2.2% 0.1% i 34.1% 34.1% 0.1% 13.6% 13.6% M–30 p-20 u-lo 1 p+lo +20 ut30 It is known that the mean is 60 and the standard deviation is 5. There are 55 students in the class. If an exam paper is selected at random, what is the probability that it will be a failing paper? (Round your answer to three decimal places.)
 Suppose that, for a certain exam, a teacher grades on a curve. Frequency 0.1% 3 4.1% 34.1% 2.2% L 0.1% 13.6% 13.6% M–30 k-20 -lo u+lo u+20 p+30 It is known that the mean is 60 and the standard deviation is 10. There are 35 students in the class. What score would be necessary to obtain an A? or above
 Grades on a biology exam are approximately normally distributed with a mean of 78 and a standard deviation of 8. Originally Dr. Smith decides to curve course grades as follows: Students who score above the 90 percentile will receive an A Students whose scores are in the 80-89.percentiles receive a B Students whose scores are in the 70th-795h percentiles receive a C Students whose scores are in the 60-69 percentiles receive a D Students who score below the 60th percentile...
 Test grades on the last statistics exam had a mean = 77 and standard deviation = 24 Suppose the teacher decides to curve by subtraction 32 from all scores then doubling the values. If Y represents the new test scores, what is the mean and standard deviation of Y? a) EM-90; ơ--59.2 b) EM = 154;Oy=9.6 c) EM-122; σ-48 EM : 45; σ--27.2 e) None of the above
 Suppose that, for a certain mathematics class, the scores are normally distributed with a mean of 75 and a standard deviation of 9. The teacher wishes to give A's to the top 5% of the students and F's to the bottom 5%. The next 15% in either direction will be given B's and D's, with the other students receiving C's. Find the bottom cutoff for receiving an A grade. (You may need to use the standard normal distribution table. Round...
Most questions answered within 3 hours.
-
Where is the error in this code sequence?
String s1 = "Hello";
String s2 = "ello";...
asked 10 months ago -
Financial data for Joel de Paris, Inc., for last year
follow:
Joel de Paris, Inc.
Balance...
asked 10 months ago -
Consider this reaction:
Al2(SO4)3 (aq)+ BaCl3
(aq) Al2Cl6 (aq)- +
3BaSO4(s) . What is the...
asked 10 months ago -
Suppose that Savneet is considering increasing her
recent random sample from 20 car rentals to 40...
asked 10 months ago -
Trucks arrive at an unloading terminal at an average rate of 120
per hour.
Trucks arrive...
asked 10 months ago -
Why are methanol and ethanol completely soluble in water while
octanol is not very little soluble....
asked 10 months ago -
A facilities manager at a university reads in a research report
that the mean amount of...
asked 10 months ago -
When the CuSO4 is rehydrated by adding water to the anhydrous
compound, is this an endothermic...
asked 10 months ago -
A ray of sunlight is passing from diamond into crown glass; the
angle of incidence is...
asked 10 months ago -
A block of mass 0.249 kg is placed on top of a light, vertical
spring of...
asked 10 months ago -
how do the kidneys compensate in the presences of acidosis
a) trigger hyperventilate
b) reserve acid...
asked 10 months ago -
Question 501 pts
The rental rate of capital to the firm increases. Which of the
following...
asked 10 months ago