HI, I need help with answering these questions. Please explain and answer all parts. Data for all the countries and then the question at the bottom.
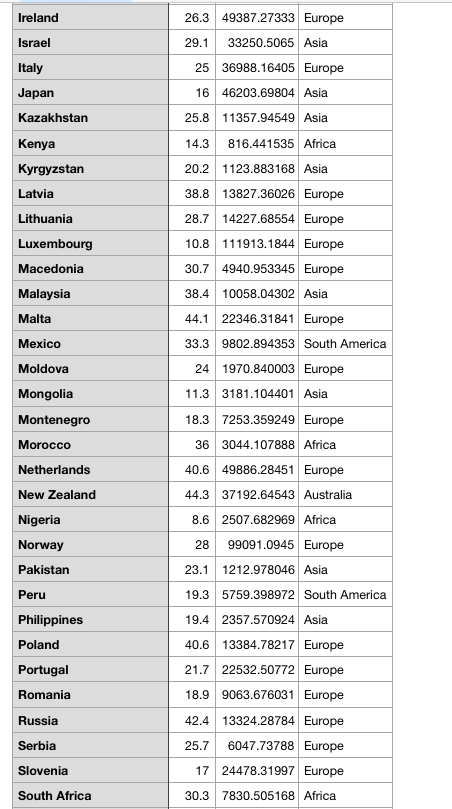

Ireland Israel Italy Japan Kazakhstan Kenya Kyrgyzstan Latvia Lithuania Luxembourg Macedonia Malaysia Malta Mexico Moldova Mongolia Montenegro Morocco Netherlands New Zealand Nigeria Norway Pakistan Peru Philippines Poland Portugal Romania Russia Serbia Slovenia South Africa 26.3 49387.27333 Europe 29.133250.5065 Asia 25 36988.16405 Europe 16 46203.69804 Asia 25.8 11357.94549 Asia 14.3 816.441535 Africa 20.2 1123.883168 Asia 38.8 13827.36026 Europe 28.7 14227.68554 Europe 10.8 111913.1844 Europe 30.7 4940.953345 Europe 38.4 10058.04302 Asia 44.1 22346.31841Europe 33.3 9802.894353 South America 24 1970.840003 Europe 11.3 3181.104401 Asia 18.3 7253.359249 Europe 36 3044.107888 Africa 40.649886.28451 Europe 44.3 37192.64543 Australia 8.6 2507.682969 Africa 28 99091.0945 Europe 23.1 1212.978046 Asia 19.3 5759.398972 South America 19.4 2357.570924 Asia 40.6 13384.78217Europe 21.7 22532.50772 Europe 18.9 9063.676031 Europe 42.4 13324.28784 Europe 25.7 6047.73788 Europe 17 24478.31997 Europe 30.3 7830.505168 Africa
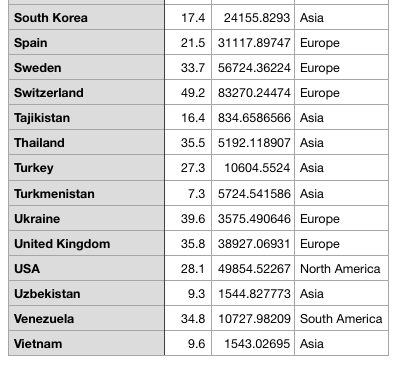
South Korea Spain Sweden Switzerland Tajikistan Thailand Turkey Turkmenistan Ukraine United Kingdom USA Uzbekistan Venezuela Vietnam 17.4 24155.8293 Asia 21.5 31117.89747 Europe 33.7 56724.36224 Europe 49.2 83270.24474 Europe 16.4 834.6586566 Asia 35.5 5192.118907Asia 27.3 10604.5524Asia 7.3 5724.541586 Asia 39.6 3575.490646 Europe 35.8 38927.06931 Europe 28.1 49854.52267 North America 9.3 1544.827773 Asia 34.8 10727.98209 South America 9.6 1543.02695 Asia
Question 8: Calculate and interpret the correlation between sugar consumption and GDP. Describe your findings in one paragraph or less.
Homework Answers
Sugar Values X is
∑ = 1994.9
Mean = 26.599
∑(X - Mx)2 = SSx = 8258.01
GDP Values Y is
∑ = 1626334.401
Mean = 21684.459
∑(Y - My)2 = SSy =
42290592466.331
X and Y Combined
N = 75
∑(X - Mx)(Y - My) = 5615579.317
R Calculation
Correlation r = ∑((X - My)(Y - Mx)) /
√((SSx)(SSy))
Correlation r = 5615579.317 / √((8258.01)(42290592466.331)) =
0.3005
Meta Numerics (cross-check)
Correlation r = 0.3005
Although technically a positive correlation, the relationship between your variables is weak (nb. the nearer the value is to zero, the weaker the relationship).
Click here to calculate a p-value.
The value of R2, the coefficient of determination, is 0.0903.
Add Answer to:
HI, I need help with answering these questions. Please explain and answer all parts. Data for all...
HI, I need help with this question. Please answer in details. The data set is found below for eac...
 HI, I need help with this question. Please answer in details.
The data set is found below for each countries sugar consumption.
Thanks!
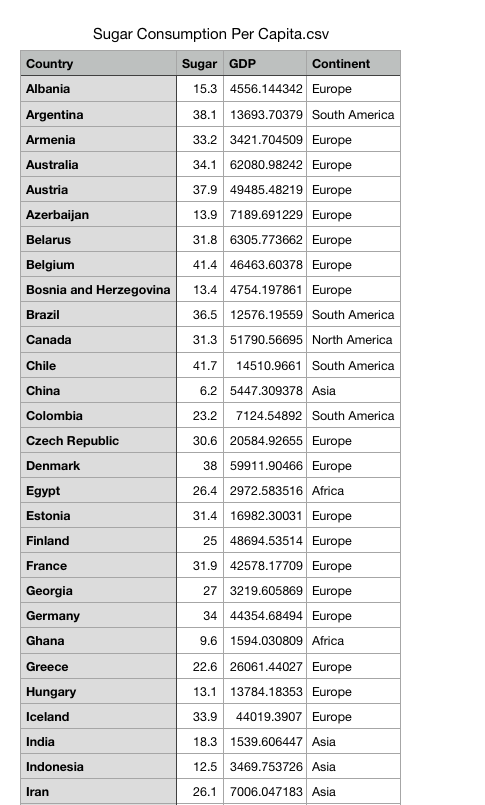
Country,Sugar, GDP, Continent Albania,15.3,4556.144342, Europe Argentina, 38.1,13693.70379, South America Armenia, 33.2,3421.704509, Europe Australia, 34.1, 62080.98242, Europe Austria, 37.9,49485.48219, Europe Azerbaijan,13.9,7189.691229, Europe Belarus,31.8,6305.773662, Europe Belgium, 41.4,46463.60378, Europe Bosnia and Herzegovina,13.4,4754.197861, Europe Brazil, 36.5,12576.19559, South America Canada, 31.3,51790.56695, North America Chile, 41.7,14510.9661, South America China, 6.2,5447.309378,Asia Colombia,23.2, 7124.54892, South America Czech Republic, 30.6,20584.92655, Europe Denmark, 38,59911.90466,Europe Egypt, 26.4,2972.583516,Africa Estonia,31.4,16982.30031,...
HI, I need help with this question. Please answer in details.
The data set is found below for each countries sugar consumption.
Thanks!
Country,Sugar, GDP, Continent Albania,15.3,4556.144342, Europe Argentina, 38.1,13693.70379, South America Armenia, 33.2,3421.704509, Europe Australia, 34.1, 62080.98242, Europe Austria, 37.9,49485.48219, Europe Azerbaijan,13.9,7189.691229, Europe Belarus,31.8,6305.773662, Europe Belgium, 41.4,46463.60378, Europe Bosnia and Herzegovina,13.4,4754.197861, Europe Brazil, 36.5,12576.19559, South America Canada, 31.3,51790.56695, North America Chile, 41.7,14510.9661, South America China, 6.2,5447.309378,Asia Colombia,23.2, 7124.54892, South America Czech Republic, 30.6,20584.92655, Europe Denmark, 38,59911.90466,Europe Egypt, 26.4,2972.583516,Africa Estonia,31.4,16982.30031,...
Will reward thumbs up 100% if works. thank you Pickling with Python code and Pandas code Do both ...
Will reward thumbs up 100% if works. thank you Pickling with Python code and Pandas code Do both pickling assignment in one Jupyter Notebook file. Python Pickle steps: Download the CSV file. Load into a Pandas DataFrame. Make the column ‘country’ the index. Print the header. Using Python code, pickle the DataFrame and name the file: PythonPickle. Load back the PythonPickle data into the DataFrame. Print the header. (Note both printed headers should match.) Pandas Pickle steps: Download the CSV...
Country Continent GDP (millions of US$) Afghanistan Asia  
Country Continent GDP (millions of US$) Afghanistan Asia 18,181 Albania Europe 12,847 Algeria Africa 190,709 Angola Africa 100,948 Argentina South America 447,644 Australia Oceania 1,488,221 Austria Europe 419,243 Azerbaijan Europe 62,321 Bahrain Asia 26,108 Bangladesh Asia 113,032 Belarus Europe 55,483 Belgium Europe 513,396 Bolivia Africa 24,604 Bosnia and Herzegovina Europe 17,965 Botswana Africa 17,570 Brazil South America 2,492,908 Brunei Asia 15,533 Bulgaria Europe...
DATA: # happy2.py import csv def main(): happy_dict = make_happy_dict() print_sorted_dictionary(happy_dict) def make_happy_dict(): filename = "happiness.csv"...
 DATA:
# happy2.py
import csv
def main():
happy_dict = make_happy_dict()
print_sorted_dictionary(happy_dict)
def make_happy_dict():
filename = "happiness.csv"
happy_dict={}
with open(filename, 'r') as infile:
csv_happy = csv.reader(infile)
infile.readline()
for line in csv_happy:
happy_dict[line[0]] = line[2]
return happy_dict
def lookup_happiness_by_country(happy_dict):
return
def print_sorted_dictionary(D):
if type(D) != type({}):
print("Dictionary not found")
return
print("Contents of dictionary sorted by key.")
print("Key","Value")
for key in sorted(D.keys()):
print(key, D[key])
main()
"happines.csv"
Country,Year of Estimate,Happiness Index
Afghanistan,2018,2.694303274
Albania,2018,5.004402637
Algeria,2018,5.043086052
Angola,2014,3.794837952
Argentina,2018,5.792796612
Armenia,2018,5.062448502
Australia,2018,7.17699337
Austria,2018,7.396001816
Azerbaijan,2018,5.167995453
Bahrain,2017,6.227320671
Bangladesh,2018,4.499217033...
DATA:
# happy2.py
import csv
def main():
happy_dict = make_happy_dict()
print_sorted_dictionary(happy_dict)
def make_happy_dict():
filename = "happiness.csv"
happy_dict={}
with open(filename, 'r') as infile:
csv_happy = csv.reader(infile)
infile.readline()
for line in csv_happy:
happy_dict[line[0]] = line[2]
return happy_dict
def lookup_happiness_by_country(happy_dict):
return
def print_sorted_dictionary(D):
if type(D) != type({}):
print("Dictionary not found")
return
print("Contents of dictionary sorted by key.")
print("Key","Value")
for key in sorted(D.keys()):
print(key, D[key])
main()
"happines.csv"
Country,Year of Estimate,Happiness Index
Afghanistan,2018,2.694303274
Albania,2018,5.004402637
Algeria,2018,5.043086052
Angola,2014,3.794837952
Argentina,2018,5.792796612
Armenia,2018,5.062448502
Australia,2018,7.17699337
Austria,2018,7.396001816
Azerbaijan,2018,5.167995453
Bahrain,2017,6.227320671
Bangladesh,2018,4.499217033...
ONLY ANSWER THE QUESTIONS AT THE BOTTOM Case Description Corporations with international operations need to assess...
 ONLY ANSWER THE QUESTIONS AT THE BOTTOM
Case Description
Corporations with international operations need to assess the
risks associated with setting up and maintaining operations in
different regions of the world. Consideration of the risks include
considering such issues as political and economic stability. One
indicator of the healthcare and quality of life in a country or
region that is considered correlated with the risk and stability in
the region is the child mortality rate. As a result, the healthcare...
ONLY ANSWER THE QUESTIONS AT THE BOTTOM
Case Description
Corporations with international operations need to assess the
risks associated with setting up and maintaining operations in
different regions of the world. Consideration of the risks include
considering such issues as political and economic stability. One
indicator of the healthcare and quality of life in a country or
region that is considered correlated with the risk and stability in
the region is the child mortality rate. As a result, the healthcare...
ONLY ANSWER THE QUESTIONS AT THE BOTTOM Case Description Corporations with international operations need to assess...
 ONLY ANSWER THE QUESTIONS AT THE BOTTOM
Case Description
Corporations with international operations need to assess the
risks associated with setting up and maintaining operations in
different regions of the world. Consideration of the risks include
considering such issues as political and economic stability. One
indicator of the healthcare and quality of life in a country or
region that is considered correlated with the risk and stability in
the region is the child mortality rate. As a result, the healthcare...
ONLY ANSWER THE QUESTIONS AT THE BOTTOM
Case Description
Corporations with international operations need to assess the
risks associated with setting up and maintaining operations in
different regions of the world. Consideration of the risks include
considering such issues as political and economic stability. One
indicator of the healthcare and quality of life in a country or
region that is considered correlated with the risk and stability in
the region is the child mortality rate. As a result, the healthcare...
8 AutoSave D The Home Data Review View Help Power Pivot Formulas Insert Draw Page Layout...
 8 AutoSave D The Home Data Review View Help Power Pivot Formulas Insert Draw Page Layout ES - per capita GDP 1 Country Name 2 Central African Republic 3 Myanmar 4 Congo, Dem. Rep. 5 South Sudan 6 Madagascar 7 Burundi 8 Ethiopia 9 Guinea 10 Malawi 11 Niger 12 Gambia, The 13 Bangladesh 14 Guinea-Bissau 15 Lao PDR 16 Benin 17 Pakistan 18 Chad 19 Nepal 20 Mozambique 21 uberia 22 Kenya 23 Senegal 24 Burkina Faso 25 Mauritania...
Please help me answer theses practice questions QUESTION 2 Which of the following can a country...
 Please help me answer theses practice questions
QUESTION 2 Which of the following can a country implement to protect local industries (e.g. bicycles) according to the video on the deceptive promise of free trade? Border walls local training programs to strengthen local industries protectionist policies such as tarrifs creating a high minimum wage locally governments can't do anything QUESTION 3 Which of the following European countries has a trade surpluse with the US as well as most other European countries...
Please help me answer theses practice questions
QUESTION 2 Which of the following can a country implement to protect local industries (e.g. bicycles) according to the video on the deceptive promise of free trade? Border walls local training programs to strengthen local industries protectionist policies such as tarrifs creating a high minimum wage locally governments can't do anything QUESTION 3 Which of the following European countries has a trade surpluse with the US as well as most other European countries...
 HI, I need help with this question. Please answer in details.
The data set is found below for each countries sugar consumption.
Thanks!
Country,Sugar, GDP, Continent Albania,15.3,4556.144342, Europe Argentina, 38.1,13693.70379, South America Armenia, 33.2,3421.704509, Europe Australia, 34.1, 62080.98242, Europe Austria, 37.9,49485.48219, Europe Azerbaijan,13.9,7189.691229, Europe Belarus,31.8,6305.773662, Europe Belgium, 41.4,46463.60378, Europe Bosnia and Herzegovina,13.4,4754.197861, Europe Brazil, 36.5,12576.19559, South America Canada, 31.3,51790.56695, North America Chile, 41.7,14510.9661, South America China, 6.2,5447.309378,Asia Colombia,23.2, 7124.54892, South America Czech Republic, 30.6,20584.92655, Europe Denmark, 38,59911.90466,Europe Egypt, 26.4,2972.583516,Africa Estonia,31.4,16982.30031,...
HI, I need help with this question. Please answer in details.
The data set is found below for each countries sugar consumption.
Thanks!
Country,Sugar, GDP, Continent Albania,15.3,4556.144342, Europe Argentina, 38.1,13693.70379, South America Armenia, 33.2,3421.704509, Europe Australia, 34.1, 62080.98242, Europe Austria, 37.9,49485.48219, Europe Azerbaijan,13.9,7189.691229, Europe Belarus,31.8,6305.773662, Europe Belgium, 41.4,46463.60378, Europe Bosnia and Herzegovina,13.4,4754.197861, Europe Brazil, 36.5,12576.19559, South America Canada, 31.3,51790.56695, North America Chile, 41.7,14510.9661, South America China, 6.2,5447.309378,Asia Colombia,23.2, 7124.54892, South America Czech Republic, 30.6,20584.92655, Europe Denmark, 38,59911.90466,Europe Egypt, 26.4,2972.583516,Africa Estonia,31.4,16982.30031,...
 DATA:
# happy2.py
import csv
def main():
happy_dict = make_happy_dict()
print_sorted_dictionary(happy_dict)
def make_happy_dict():
filename = "happiness.csv"
happy_dict={}
with open(filename, 'r') as infile:
csv_happy = csv.reader(infile)
infile.readline()
for line in csv_happy:
happy_dict[line[0]] = line[2]
return happy_dict
def lookup_happiness_by_country(happy_dict):
return
def print_sorted_dictionary(D):
if type(D) != type({}):
print("Dictionary not found")
return
print("Contents of dictionary sorted by key.")
print("Key","Value")
for key in sorted(D.keys()):
print(key, D[key])
main()
"happines.csv"
Country,Year of Estimate,Happiness Index
Afghanistan,2018,2.694303274
Albania,2018,5.004402637
Algeria,2018,5.043086052
Angola,2014,3.794837952
Argentina,2018,5.792796612
Armenia,2018,5.062448502
Australia,2018,7.17699337
Austria,2018,7.396001816
Azerbaijan,2018,5.167995453
Bahrain,2017,6.227320671
Bangladesh,2018,4.499217033...
DATA:
# happy2.py
import csv
def main():
happy_dict = make_happy_dict()
print_sorted_dictionary(happy_dict)
def make_happy_dict():
filename = "happiness.csv"
happy_dict={}
with open(filename, 'r') as infile:
csv_happy = csv.reader(infile)
infile.readline()
for line in csv_happy:
happy_dict[line[0]] = line[2]
return happy_dict
def lookup_happiness_by_country(happy_dict):
return
def print_sorted_dictionary(D):
if type(D) != type({}):
print("Dictionary not found")
return
print("Contents of dictionary sorted by key.")
print("Key","Value")
for key in sorted(D.keys()):
print(key, D[key])
main()
"happines.csv"
Country,Year of Estimate,Happiness Index
Afghanistan,2018,2.694303274
Albania,2018,5.004402637
Algeria,2018,5.043086052
Angola,2014,3.794837952
Argentina,2018,5.792796612
Armenia,2018,5.062448502
Australia,2018,7.17699337
Austria,2018,7.396001816
Azerbaijan,2018,5.167995453
Bahrain,2017,6.227320671
Bangladesh,2018,4.499217033...
 ONLY ANSWER THE QUESTIONS AT THE BOTTOM
Case Description
Corporations with international operations need to assess the
risks associated with setting up and maintaining operations in
different regions of the world. Consideration of the risks include
considering such issues as political and economic stability. One
indicator of the healthcare and quality of life in a country or
region that is considered correlated with the risk and stability in
the region is the child mortality rate. As a result, the healthcare...
ONLY ANSWER THE QUESTIONS AT THE BOTTOM
Case Description
Corporations with international operations need to assess the
risks associated with setting up and maintaining operations in
different regions of the world. Consideration of the risks include
considering such issues as political and economic stability. One
indicator of the healthcare and quality of life in a country or
region that is considered correlated with the risk and stability in
the region is the child mortality rate. As a result, the healthcare...
 ONLY ANSWER THE QUESTIONS AT THE BOTTOM
Case Description
Corporations with international operations need to assess the
risks associated with setting up and maintaining operations in
different regions of the world. Consideration of the risks include
considering such issues as political and economic stability. One
indicator of the healthcare and quality of life in a country or
region that is considered correlated with the risk and stability in
the region is the child mortality rate. As a result, the healthcare...
ONLY ANSWER THE QUESTIONS AT THE BOTTOM
Case Description
Corporations with international operations need to assess the
risks associated with setting up and maintaining operations in
different regions of the world. Consideration of the risks include
considering such issues as political and economic stability. One
indicator of the healthcare and quality of life in a country or
region that is considered correlated with the risk and stability in
the region is the child mortality rate. As a result, the healthcare...
 8 AutoSave D The Home Data Review View Help Power Pivot Formulas Insert Draw Page Layout ES - per capita GDP 1 Country Name 2 Central African Republic 3 Myanmar 4 Congo, Dem. Rep. 5 South Sudan 6 Madagascar 7 Burundi 8 Ethiopia 9 Guinea 10 Malawi 11 Niger 12 Gambia, The 13 Bangladesh 14 Guinea-Bissau 15 Lao PDR 16 Benin 17 Pakistan 18 Chad 19 Nepal 20 Mozambique 21 uberia 22 Kenya 23 Senegal 24 Burkina Faso 25 Mauritania...
 Please help me answer theses practice questions
QUESTION 2 Which of the following can a country implement to protect local industries (e.g. bicycles) according to the video on the deceptive promise of free trade? Border walls local training programs to strengthen local industries protectionist policies such as tarrifs creating a high minimum wage locally governments can't do anything QUESTION 3 Which of the following European countries has a trade surpluse with the US as well as most other European countries...
Please help me answer theses practice questions
QUESTION 2 Which of the following can a country implement to protect local industries (e.g. bicycles) according to the video on the deceptive promise of free trade? Border walls local training programs to strengthen local industries protectionist policies such as tarrifs creating a high minimum wage locally governments can't do anything QUESTION 3 Which of the following European countries has a trade surpluse with the US as well as most other European countries...
Most questions answered within 3 hours.
-
Where is the error in this code sequence?
String s1 = "Hello";
String s2 = "ello";...
asked 11 months ago -
Financial data for Joel de Paris, Inc., for last year
follow:
Joel de Paris, Inc.
Balance...
asked 11 months ago -
Consider this reaction:
Al2(SO4)3 (aq)+ BaCl3
(aq) Al2Cl6 (aq)- +
3BaSO4(s) . What is the...
asked 11 months ago -
Suppose that Savneet is considering increasing her
recent random sample from 20 car rentals to 40...
asked 11 months ago -
Trucks arrive at an unloading terminal at an average rate of 120
per hour.
Trucks arrive...
asked 11 months ago -
Why are methanol and ethanol completely soluble in water while
octanol is not very little soluble....
asked 11 months ago -
A facilities manager at a university reads in a research report
that the mean amount of...
asked 11 months ago -
When the CuSO4 is rehydrated by adding water to the anhydrous
compound, is this an endothermic...
asked 11 months ago -
A ray of sunlight is passing from diamond into crown glass; the
angle of incidence is...
asked 11 months ago -
A block of mass 0.249 kg is placed on top of a light, vertical
spring of...
asked 11 months ago -
how do the kidneys compensate in the presences of acidosis
a) trigger hyperventilate
b) reserve acid...
asked 11 months ago -
Question 501 pts
The rental rate of capital to the firm increases. Which of the
following...
asked 11 months ago