
Homework Answers

Add Answer to:
Insérer Tableau Graphique Texte Figure Données multimédias Commenta HOMEWORK 2 Suppose the capita...
4 of them needed to be solved 2. National income = 3000, Net foreign factor outcome...
 4
of them needed to be solved
2. National income = 3000, Net foreign factor outcome from a country = 200, indirect business taxes = 1300. gross domestic product = 6000. Find Consumption of fixed capital. 3. Unemployment rate, amount of unemployed and amount of population out of labor are accordingly 8%, 320000, 2000000. Find the total population and labor force of a country 4. Initial GDP, GDP growth and multiplier are accordingly 1600, 400 and 2.5. Find marginal propensity...
4
of them needed to be solved
2. National income = 3000, Net foreign factor outcome from a country = 200, indirect business taxes = 1300. gross domestic product = 6000. Find Consumption of fixed capital. 3. Unemployment rate, amount of unemployed and amount of population out of labor are accordingly 8%, 320000, 2000000. Find the total population and labor force of a country 4. Initial GDP, GDP growth and multiplier are accordingly 1600, 400 and 2.5. Find marginal propensity...
Would someone explain to me how to get the answers, please. I need the graphs plotted,...
 Would someone explain to me how to get the
answers, please. I need the
graphs plotted, the blue box answer, and the fill in the blanks
answered. Below are the options.
Options for the first graph it says: From the preceding data,
you know that the level of saving in the economy was ($140
billion, $20 billion, $0 billion, $100 billion) and the
marginal propensity to save in the economy is (0.6, 0.8,
0.1, 0.2)
Options for the second graph...
Would someone explain to me how to get the
answers, please. I need the
graphs plotted, the blue box answer, and the fill in the blanks
answered. Below are the options.
Options for the first graph it says: From the preceding data,
you know that the level of saving in the economy was ($140
billion, $20 billion, $0 billion, $100 billion) and the
marginal propensity to save in the economy is (0.6, 0.8,
0.1, 0.2)
Options for the second graph...
Suppose that as an economist working for the Bureau of Labor Statistics you're given the following...
 Suppose that as an economist working for the Bureau of Labor Statistics you're given the following information for the current year: Private Disposable Income -- Federal Budget Deficit National Saving Total Domestic Investment- Total Tax Revenue Depreciation Investment Transfer Payments Gov. Interest Payments Net Factor Payments $20,000 $2,000 $3,000 $12,000 $5,000 $3,000* $1,500 S0 $1,000 *Depreciation Investment is included in total investment. With these figures, compute the following: (a)What is the level of private saving and consumption in this economy?...
you're given the 3. Suppose that as an economist working for the Bureau of Labor Statistics...
 you're given the 3. Suppose that as an economist working for the Bureau of Labor Statistics following information for the current year: Private Disposable Income Federal Budget Deficit National Saving Total Domestic Investment- Total Tax Revenue Depreciation Investment Transfer Payments Gov. Interest Payments $20,000 $2,000 $3,000 $12,000 $5,000 $3,000* $1,500 $0 Net Factor Payments $1,000 *Depreciation Investment is included in total investment. With these figures, compute the following: What is the level of private saving and consumption in this economy?...
Assume a simple model of the US economy with no international trade. Suppose the government, in...
Assume a simple model of the US economy with no international trade. Suppose the government, in an effort to stimulate the economy, increases its spending on goods and services without changing taxes. Using the model of the market for loanable funds, show how this policy will affect the levels of saving, investment, consumption, and total output in the long run. Explain your answers carefully Suppose the government did not change its level of spending but decreased taxes instead. Show how...
The net export function illustrates that:A) net exports are a positive function of domestic income....
The net export function illustrates that:A) net exports are a positive function of domestic income.B) net exports are independent of domestic income.C) net exports are a negative function of domestic income.D) imports are independent of domestic income.E) exports are independent of foreign income. Suppose the marginal propensity to import for country A is 0.4. Calculate the change in total value of imports of the country if national income increases by $100,000.A) $16,000B) $20,000C) $60,000D) $40,000E) $25,000 An MPI of 0.4 indicates that...
Consider an economy that is characterized by the Solow Model. The (aggregate) production function is given...
Consider an economy that is characterized by the Solow Model. The (aggregate) production function is given by: Y = 6K1/3L2/3 In this economy, workers consume 80% of income and save the rest. The labour force is growing at 2% per year while the annual rate of capital depreciation is 5.5%. a) Solve for the steady state capital-labour ratio and consumption per worker. The economy is in its steady state as described in part (a). Suppose both the stock of capital...
1. An economy has the production function y = 20k1/2. The current capital stock is 256...
1. An economy has the production function y = 20k1/2. The current capital stock is 256 and the depreciation rate is 8 percent, and the population growth rate is 2 percent. For income per person to grow, the saving rate must exceed Question 1 options: 6 percent 8 percent 10 percent 12 percent Question 2 (1 point) 2. According to the Solow model, if an economy decreases its saving rate, then in the new steady state, compared to the old...
5. Suppose that Jhne's incoeme inereases from $30,000 per yeir to $35,000. At the same tim,...
 5. Suppose that Jhne's incoeme inereases from $30,000 per yeir to $35,000. At the same tim, e consumption changes from $26,000 per year to $29,00 peryear. What is Jene's maginal propensity to save? a) 0.1 b) 0.3 e) 04 d) 0.6 Aggegate 4 In the above Keynesian cros diagram, the solld tine labeled "A" sepescts what curve? b) Incoma c) Inflacion 4) Ostput e) t 7. ls the above Keyncsian cross diagram which one of the Sollowing is TRUE at...
 4
of them needed to be solved
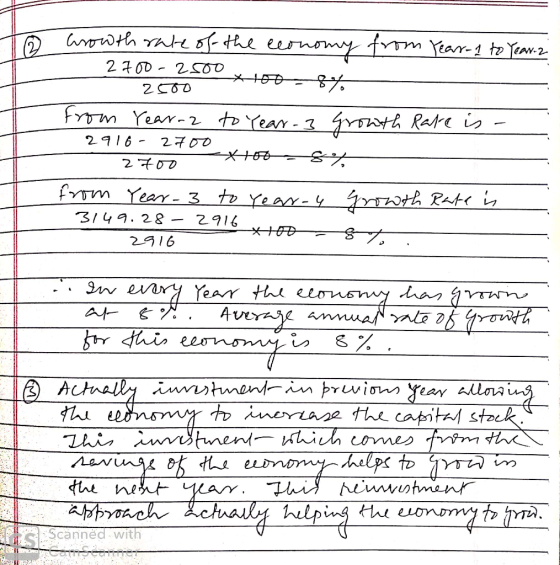
2. National income = 3000, Net foreign factor outcome from a country = 200, indirect business taxes = 1300. gross domestic product = 6000. Find Consumption of fixed capital. 3. Unemployment rate, amount of unemployed and amount of population out of labor are accordingly 8%, 320000, 2000000. Find the total population and labor force of a country 4. Initial GDP, GDP growth and multiplier are accordingly 1600, 400 and 2.5. Find marginal propensity...
4
of them needed to be solved
2. National income = 3000, Net foreign factor outcome from a country = 200, indirect business taxes = 1300. gross domestic product = 6000. Find Consumption of fixed capital. 3. Unemployment rate, amount of unemployed and amount of population out of labor are accordingly 8%, 320000, 2000000. Find the total population and labor force of a country 4. Initial GDP, GDP growth and multiplier are accordingly 1600, 400 and 2.5. Find marginal propensity...
 Would someone explain to me how to get the
answers, please. I need the
graphs plotted, the blue box answer, and the fill in the blanks
answered. Below are the options.
Options for the first graph it says: From the preceding data,
you know that the level of saving in the economy was ($140
billion, $20 billion, $0 billion, $100 billion) and the
marginal propensity to save in the economy is (0.6, 0.8,
0.1, 0.2)
Options for the second graph...
Would someone explain to me how to get the
answers, please. I need the
graphs plotted, the blue box answer, and the fill in the blanks
answered. Below are the options.
Options for the first graph it says: From the preceding data,
you know that the level of saving in the economy was ($140
billion, $20 billion, $0 billion, $100 billion) and the
marginal propensity to save in the economy is (0.6, 0.8,
0.1, 0.2)
Options for the second graph...
 Suppose that as an economist working for the Bureau of Labor Statistics you're given the following information for the current year: Private Disposable Income -- Federal Budget Deficit National Saving Total Domestic Investment- Total Tax Revenue Depreciation Investment Transfer Payments Gov. Interest Payments Net Factor Payments $20,000 $2,000 $3,000 $12,000 $5,000 $3,000* $1,500 S0 $1,000 *Depreciation Investment is included in total investment. With these figures, compute the following: (a)What is the level of private saving and consumption in this economy?...
 Suppose that as an economist working for the Bureau of Labor Statistics you're given the following information for the current year: Private Disposable Income -- Federal Budget Deficit National Saving Total Domestic Investment- Total Tax Revenue Depreciation Investment Transfer Payments Gov. Interest Payments Net Factor Payments $20,000 $2,000 $3,000 $12,000 $5,000 $3,000* $1,500 S0 $1,000 *Depreciation Investment is included in total investment. With these figures, compute the following: (a)What is the level of private saving and consumption in this economy?...
 you're given the 3. Suppose that as an economist working for the Bureau of Labor Statistics following information for the current year: Private Disposable Income Federal Budget Deficit National Saving Total Domestic Investment- Total Tax Revenue Depreciation Investment Transfer Payments Gov. Interest Payments $20,000 $2,000 $3,000 $12,000 $5,000 $3,000* $1,500 $0 Net Factor Payments $1,000 *Depreciation Investment is included in total investment. With these figures, compute the following: What is the level of private saving and consumption in this economy?...
 5. Suppose that Jhne's incoeme inereases from $30,000 per yeir to $35,000. At the same tim, e consumption changes from $26,000 per year to $29,00 peryear. What is Jene's maginal propensity to save? a) 0.1 b) 0.3 e) 04 d) 0.6 Aggegate 4 In the above Keynesian cros diagram, the solld tine labeled "A" sepescts what curve? b) Incoma c) Inflacion 4) Ostput e) t 7. ls the above Keyncsian cross diagram which one of the Sollowing is TRUE at...
Most questions answered within 3 hours.
-
Where is the error in this code sequence?
String s1 = "Hello";
String s2 = "ello";...
asked 10 months ago -
Financial data for Joel de Paris, Inc., for last year
follow:
Joel de Paris, Inc.
Balance...
asked 10 months ago -
Consider this reaction:
Al2(SO4)3 (aq)+ BaCl3
(aq) Al2Cl6 (aq)- +
3BaSO4(s) . What is the...
asked 10 months ago -
Suppose that Savneet is considering increasing her
recent random sample from 20 car rentals to 40...
asked 10 months ago -
Trucks arrive at an unloading terminal at an average rate of 120
per hour.
Trucks arrive...
asked 10 months ago -
Why are methanol and ethanol completely soluble in water while
octanol is not very little soluble....
asked 10 months ago -
A facilities manager at a university reads in a research report
that the mean amount of...
asked 10 months ago -
When the CuSO4 is rehydrated by adding water to the anhydrous
compound, is this an endothermic...
asked 10 months ago -
A ray of sunlight is passing from diamond into crown glass; the
angle of incidence is...
asked 10 months ago -
A block of mass 0.249 kg is placed on top of a light, vertical
spring of...
asked 10 months ago -
how do the kidneys compensate in the presences of acidosis
a) trigger hyperventilate
b) reserve acid...
asked 10 months ago -
Question 501 pts
The rental rate of capital to the firm increases. Which of the
following...
asked 10 months ago