
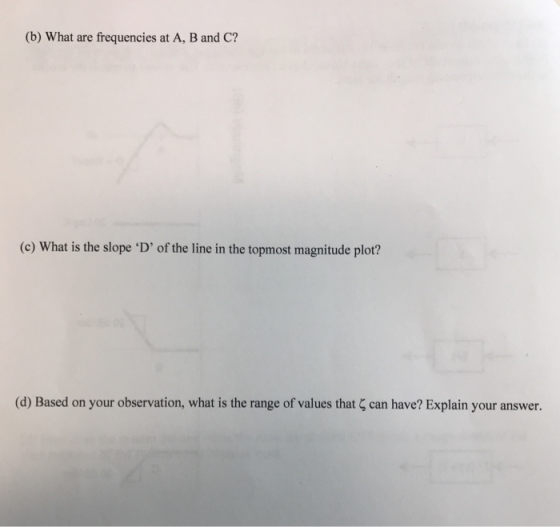
(b) What are frequencies at A, B and C? (c) What is the slope D' of the line in the topmost magnitude plot? (d) Based on your observation, what is the range of values that 5 can have? Explain your answer.
Homework Answers
Add Answer to:
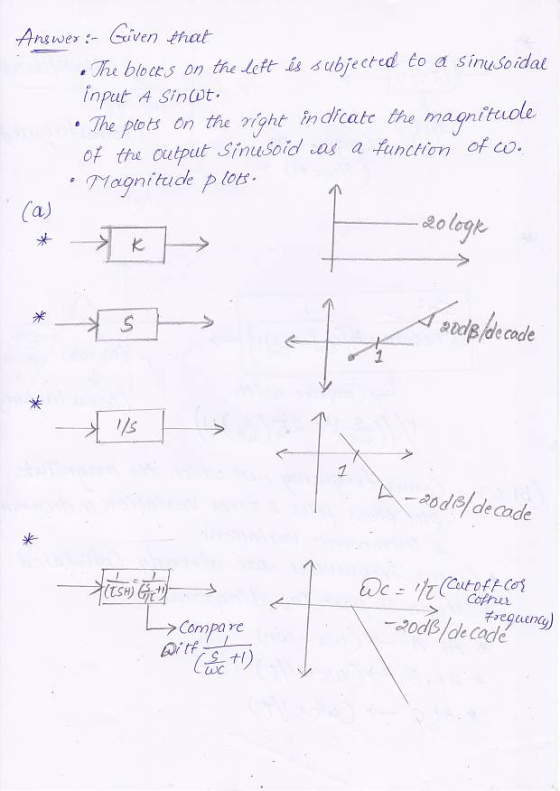
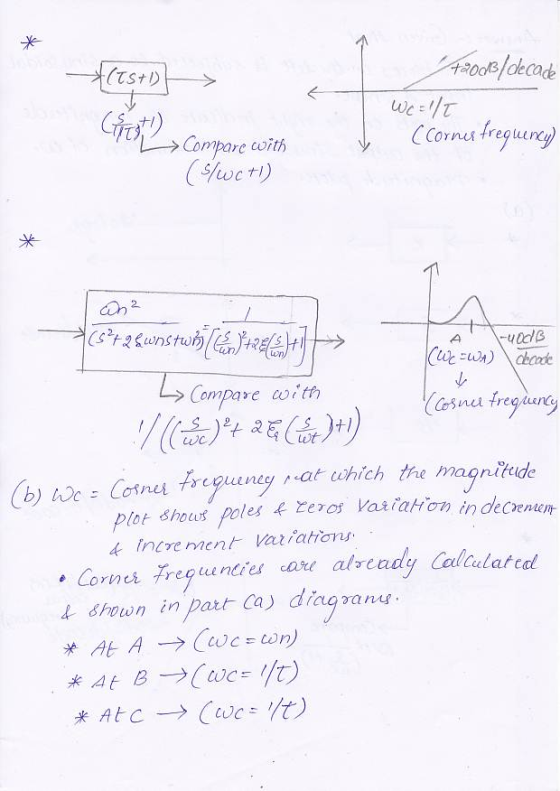
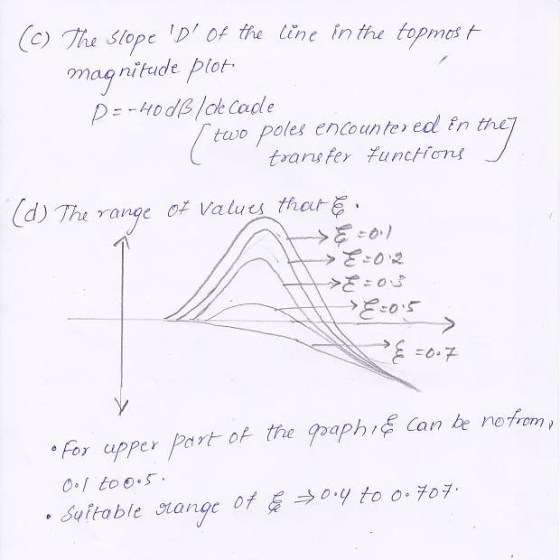
(a) Each of the blocks on the left is subjected to a sinusoidal input ASinot. The plots on the ri...
please answer thoroughly ahow each step.. please provide detail bode plots.. please answer complelty Consider the...
 please answer thoroughly ahow each step.. please provide detail
bode plots.. please answer complelty
Consider the following transfer function: G(8) = Tstl 1. Write the polar form of hand 1+jWT 2. Write the magnitude and phase of G(jw). 3. Write the magnitude in dB of G(jw). 4. What is the approximate magnitude of Gw) in dBs for the low and high frequencies w, respectively? 5. What is the approximate phase of G(w) for the low and high frequencies w, respec-...
please answer thoroughly ahow each step.. please provide detail
bode plots.. please answer complelty
Consider the following transfer function: G(8) = Tstl 1. Write the polar form of hand 1+jWT 2. Write the magnitude and phase of G(jw). 3. Write the magnitude in dB of G(jw). 4. What is the approximate magnitude of Gw) in dBs for the low and high frequencies w, respectively? 5. What is the approximate phase of G(w) for the low and high frequencies w, respec-...
Sketch the straight-line approximation Bode plot diagrams (magnitude and phase) 110s for H[s] You might want...
 Sketch the straight-line approximation Bode plot diagrams (magnitude and phase) 110s for H[s] You might want to examine Examples E.1 and E.2 in (s+10)(s+100)´ the textbook. Based on your straight-line Bode plot sketch, answer the following questions. The questions are: a. Identify the transfer function written in time constant form. b. The phase of H[s] at low frequencies is? c. The magnitude plot has what slope at low frequencies? d. The magnitude plot has what slope at high frequencies? e....
For each filter mentioned in the following cases, first simulate the circuit using Multisim. You can get a plot of the transfer function that is called the Bode plot. From the right toolbar, select &...
 For each filter mentioned in the following cases, first simulate the circuit using Multisim. You can get a plot of the transfer function that is called the Bode plot. From the right toolbar, select "Bode Plotter". Change initial (I) and final (F frequencies to 1Hz and 200 KHz, respectively. Use a Voltage AC source as the input signal. You do not need to change any parameter from voltage AC source Connect "Bode Plotter" to input and output of your circuit...
Simulation For each filter mentioned in the following cases, first simulate the circuit using Multisim. You can get a plot of the transfer function that is called the Bode plot. From the right toolba...
 Simulation For each filter mentioned in the following cases, first simulate the circuit using Multisim. You can get a plot of the transfer function that is called the Bode plot. From the right toolbar, select "Bode Plotter". Change initial (I) and final (F) frequencies to 1Hz and 200 KHz, respectively. Use a Voltage AC source as the input signal. You do not need to change any parameter from voltage AC source. Connect "Bode Plotter" to input and output of your...
A decibel (dB) is a logarithmic unit used to express the ratio of two values of...
 A decibel (dB) is a logarithmic unit used to express the ratio of two values of a physical quantity, often sound level, power or intensity. It is given by: dB - 20 logx Where x is the ratio. Convert the following numbers to dB 1. x=01 dB- dB = 3. x 10 dB- 4. x=473 dB : 5.x=1000 dB= Problem 2 (10 points) Convert the following numbers in dBs to magnitudes (i.e. find x) . -55 dB -17 dB_ 4,...
Problem 1 Consider the following asymptotic Bode plots. Note that the frequencies are in Hz. For...
 Problem 1 Consider the following asymptotic Bode plots. Note that the frequencies are in Hz. For each frequency response shown in (a)-(d), do the following: 1. Determine the transfer function H(s). 2. Synthesize H(s) using the RC circuits shown in Tables 3.4, 4.2 and 4.3 of the handout. Use as few opamps, resistors and capacitors as possible to simplify your design. Note: If you prefer, you can down-scale (by a frequency scaling factor ky) the original frequency response to work...
please identify if it first or second order. For the following, generate simple bode plots (both...
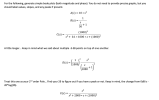 please identify if it first or second order.
For the following, generate simple bode plots (both magnitude and phase). You do not need to provide precise graphs, but you should label values, slopes, and any peaks if present. A(s) 10 1 B(s) S -+1 50 (1000)2 C(s) s20.1 1000 s+(1000) A little longer... Keep in mind what we said about multiple -3 dB points on top of one another. C 1 D(s)=1000) 1 (1000 Treat this one as your 2nd...
please identify if it first or second order.
For the following, generate simple bode plots (both magnitude and phase). You do not need to provide precise graphs, but you should label values, slopes, and any peaks if present. A(s) 10 1 B(s) S -+1 50 (1000)2 C(s) s20.1 1000 s+(1000) A little longer... Keep in mind what we said about multiple -3 dB points on top of one another. C 1 D(s)=1000) 1 (1000 Treat this one as your 2nd...
B Frequency Response Modeling Frequency response modeling of a linear system is based on the prem...
 Please explain every step as clearly and detailed as
possible.
B Frequency Response Modeling Frequency response modeling of a linear system is based on the premise that the dynamics of a linear system can be recovered from a knowledge of how the system responds to sinusoidal inputs. (This will be made mathematically precise in Theorem 13.) In other words, to determine (or iden- tify) a linear system, all one has to do is observe how the system reacts to sinusoidal...
Please explain every step as clearly and detailed as
possible.
B Frequency Response Modeling Frequency response modeling of a linear system is based on the premise that the dynamics of a linear system can be recovered from a knowledge of how the system responds to sinusoidal inputs. (This will be made mathematically precise in Theorem 13.) In other words, to determine (or iden- tify) a linear system, all one has to do is observe how the system reacts to sinusoidal...
Consider three (causal) LTI systems, corresponding to transfer functions described (except for gain K) by the...
 Consider three (causal) LTI systems, corresponding to transfer functions described (except for gain K) by the following pole-zero plots. Im Im ++j10 X - -100 - 10 Re -10 : 5 * +-j10 Pole-Zero Plot for System A Pole-Zero Plot for System B Pole-Zero Plot for System C In each part below, determine which of the three systems can meet the given specifications, including any implications on what value(s) the transfer function's gain K must be. (a) (10 points) The...
Consider the filter circuit (Figure 1) with R=500 N and C ==uF. Learning Goal: To understand...
 Consider the filter circuit (Figure 1) with R=500 N and C ==uF. Learning Goal: To understand how to find the transfer function of a filter circuit and to be able to draw the asymptotes of the Bode magnitude and phase diagrams Bode plots are used to display the amplitude and phase of a transfer function. The amplitude is typically displayed by showing the magnitude of the transfer function on the vertical axis and the frequency on the horizontal axis using...
 please answer thoroughly ahow each step.. please provide detail
bode plots.. please answer complelty
Consider the following transfer function: G(8) = Tstl 1. Write the polar form of hand 1+jWT 2. Write the magnitude and phase of G(jw). 3. Write the magnitude in dB of G(jw). 4. What is the approximate magnitude of Gw) in dBs for the low and high frequencies w, respectively? 5. What is the approximate phase of G(w) for the low and high frequencies w, respec-...
please answer thoroughly ahow each step.. please provide detail
bode plots.. please answer complelty
Consider the following transfer function: G(8) = Tstl 1. Write the polar form of hand 1+jWT 2. Write the magnitude and phase of G(jw). 3. Write the magnitude in dB of G(jw). 4. What is the approximate magnitude of Gw) in dBs for the low and high frequencies w, respectively? 5. What is the approximate phase of G(w) for the low and high frequencies w, respec-...
 Sketch the straight-line approximation Bode plot diagrams (magnitude and phase) 110s for H[s] You might want to examine Examples E.1 and E.2 in (s+10)(s+100)´ the textbook. Based on your straight-line Bode plot sketch, answer the following questions. The questions are: a. Identify the transfer function written in time constant form. b. The phase of H[s] at low frequencies is? c. The magnitude plot has what slope at low frequencies? d. The magnitude plot has what slope at high frequencies? e....
 For each filter mentioned in the following cases, first simulate the circuit using Multisim. You can get a plot of the transfer function that is called the Bode plot. From the right toolbar, select "Bode Plotter". Change initial (I) and final (F frequencies to 1Hz and 200 KHz, respectively. Use a Voltage AC source as the input signal. You do not need to change any parameter from voltage AC source Connect "Bode Plotter" to input and output of your circuit...
 Simulation For each filter mentioned in the following cases, first simulate the circuit using Multisim. You can get a plot of the transfer function that is called the Bode plot. From the right toolbar, select "Bode Plotter". Change initial (I) and final (F) frequencies to 1Hz and 200 KHz, respectively. Use a Voltage AC source as the input signal. You do not need to change any parameter from voltage AC source. Connect "Bode Plotter" to input and output of your...
 A decibel (dB) is a logarithmic unit used to express the ratio of two values of a physical quantity, often sound level, power or intensity. It is given by: dB - 20 logx Where x is the ratio. Convert the following numbers to dB 1. x=01 dB- dB = 3. x 10 dB- 4. x=473 dB : 5.x=1000 dB= Problem 2 (10 points) Convert the following numbers in dBs to magnitudes (i.e. find x) . -55 dB -17 dB_ 4,...
 Problem 1 Consider the following asymptotic Bode plots. Note that the frequencies are in Hz. For each frequency response shown in (a)-(d), do the following: 1. Determine the transfer function H(s). 2. Synthesize H(s) using the RC circuits shown in Tables 3.4, 4.2 and 4.3 of the handout. Use as few opamps, resistors and capacitors as possible to simplify your design. Note: If you prefer, you can down-scale (by a frequency scaling factor ky) the original frequency response to work...
 please identify if it first or second order.
For the following, generate simple bode plots (both magnitude and phase). You do not need to provide precise graphs, but you should label values, slopes, and any peaks if present. A(s) 10 1 B(s) S -+1 50 (1000)2 C(s) s20.1 1000 s+(1000) A little longer... Keep in mind what we said about multiple -3 dB points on top of one another. C 1 D(s)=1000) 1 (1000 Treat this one as your 2nd...
please identify if it first or second order.
For the following, generate simple bode plots (both magnitude and phase). You do not need to provide precise graphs, but you should label values, slopes, and any peaks if present. A(s) 10 1 B(s) S -+1 50 (1000)2 C(s) s20.1 1000 s+(1000) A little longer... Keep in mind what we said about multiple -3 dB points on top of one another. C 1 D(s)=1000) 1 (1000 Treat this one as your 2nd...
 Please explain every step as clearly and detailed as
possible.
B Frequency Response Modeling Frequency response modeling of a linear system is based on the premise that the dynamics of a linear system can be recovered from a knowledge of how the system responds to sinusoidal inputs. (This will be made mathematically precise in Theorem 13.) In other words, to determine (or iden- tify) a linear system, all one has to do is observe how the system reacts to sinusoidal...
Please explain every step as clearly and detailed as
possible.
B Frequency Response Modeling Frequency response modeling of a linear system is based on the premise that the dynamics of a linear system can be recovered from a knowledge of how the system responds to sinusoidal inputs. (This will be made mathematically precise in Theorem 13.) In other words, to determine (or iden- tify) a linear system, all one has to do is observe how the system reacts to sinusoidal...
 Consider three (causal) LTI systems, corresponding to transfer functions described (except for gain K) by the following pole-zero plots. Im Im ++j10 X - -100 - 10 Re -10 : 5 * +-j10 Pole-Zero Plot for System A Pole-Zero Plot for System B Pole-Zero Plot for System C In each part below, determine which of the three systems can meet the given specifications, including any implications on what value(s) the transfer function's gain K must be. (a) (10 points) The...
 Consider the filter circuit (Figure 1) with R=500 N and C ==uF. Learning Goal: To understand how to find the transfer function of a filter circuit and to be able to draw the asymptotes of the Bode magnitude and phase diagrams Bode plots are used to display the amplitude and phase of a transfer function. The amplitude is typically displayed by showing the magnitude of the transfer function on the vertical axis and the frequency on the horizontal axis using...
Most questions answered within 3 hours.
-
Where is the error in this code sequence?
String s1 = "Hello";
String s2 = "ello";...
asked 11 months ago -
Financial data for Joel de Paris, Inc., for last year
follow:
Joel de Paris, Inc.
Balance...
asked 11 months ago -
Consider this reaction:
Al2(SO4)3 (aq)+ BaCl3
(aq) Al2Cl6 (aq)- +
3BaSO4(s) . What is the...
asked 11 months ago -
Suppose that Savneet is considering increasing her
recent random sample from 20 car rentals to 40...
asked 11 months ago -
Trucks arrive at an unloading terminal at an average rate of 120
per hour.
Trucks arrive...
asked 11 months ago -
Why are methanol and ethanol completely soluble in water while
octanol is not very little soluble....
asked 11 months ago -
A facilities manager at a university reads in a research report
that the mean amount of...
asked 11 months ago -
When the CuSO4 is rehydrated by adding water to the anhydrous
compound, is this an endothermic...
asked 11 months ago -
A ray of sunlight is passing from diamond into crown glass; the
angle of incidence is...
asked 11 months ago -
A block of mass 0.249 kg is placed on top of a light, vertical
spring of...
asked 11 months ago -
how do the kidneys compensate in the presences of acidosis
a) trigger hyperventilate
b) reserve acid...
asked 11 months ago -
Question 501 pts
The rental rate of capital to the firm increases. Which of the
following...
asked 11 months ago