Homework Answers
Add Answer to:
For each of the transfer functions given below, draw the pole-zero plot and using the log- semilog paper provided on Blackboard to plot the magnitude separate from the phase as a function of frequenc...
For each of the transfer functions given below, draw the pole-zero plot and plot the magnitude separate from the phase as a function of frequency. Show only the asymptotic terms that make up the tra...
 For each of the transfer functions given below, draw the pole-zero plot and plot the magnitude separate from the phase as a function of frequency. Show only the asymptotic terms that make up the transfer function and then add them to show the composite plot. You can verify your plots (to some extent) by using MATLAB to generate the plots but only as a check that the work you have done is correct. The work that will count for points...
3. Draw the Bode plot (magnitude and phase) for the transfer function H(s) of a CT...
 3. Draw the Bode plot (magnitude and phase) for the transfer function H(s) of a CT LTI given by H(s) 4000 only the asymptotic plot of the terms that make up the transfer function but also show the composite plot that adds all the terms that make up the transfer function. S+2000s+10 where the ROC includes the ja axis. Show
For each of the following transfer functions, plot the pole-zero pattern, draw curves of M(a) ver...
 For each of the following transfer functions, plot the pole-zero pattern, draw curves of M(a) versus ω and θ(a) versus ω, and comment briefly on your results. For the function in part (c), include the numerical values for ω- 9.9, 10.0, and 10.1 rad/s. 2 H(s)= s2+2s +1 a. 2s2 H (s) = 0.25+100 C.
For each of the following transfer functions, plot the pole-zero pattern, draw curves of M(a) versus ω and θ(a) versus ω, and comment briefly on...
For each of the following transfer functions, plot the pole-zero pattern, draw curves of M(a) versus ω and θ(a) versus ω, and comment briefly on your results. For the function in part (c), include the numerical values for ω- 9.9, 10.0, and 10.1 rad/s. 2 H(s)= s2+2s +1 a. 2s2 H (s) = 0.25+100 C.
For each of the following transfer functions, plot the pole-zero pattern, draw curves of M(a) versus ω and θ(a) versus ω, and comment briefly on...
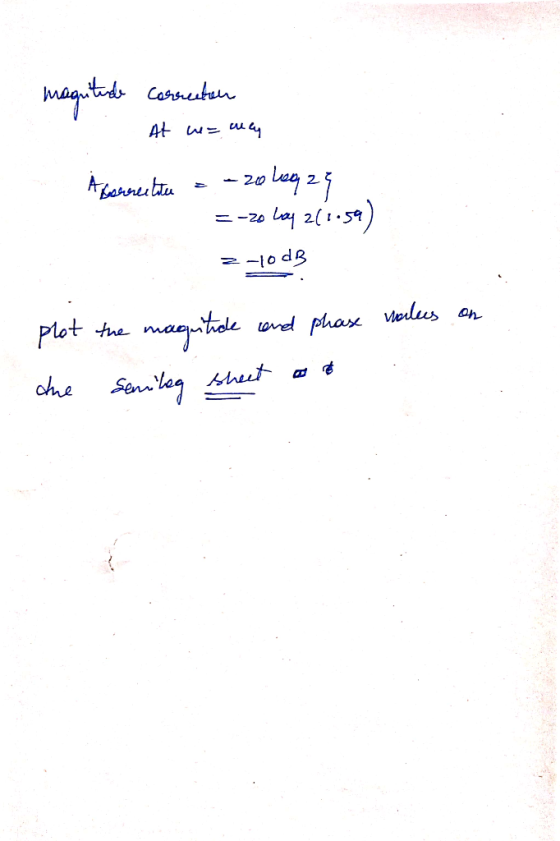
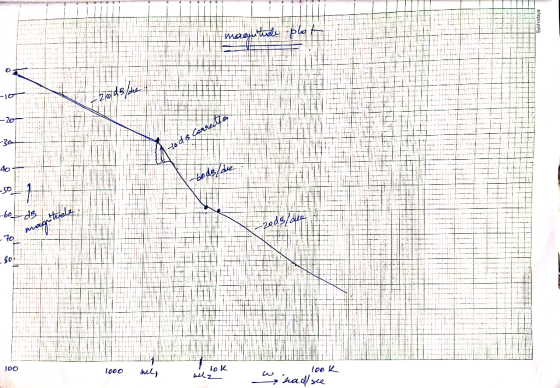
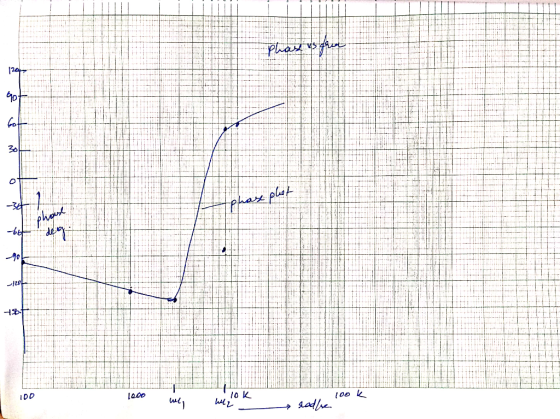
25 G(s) draw the bode (magnitude and [13] For the system with transfer function s2+4s+25 phase) plot on the semi-log pa...
 25 G(s) draw the bode (magnitude and [13] For the system with transfer function s2+4s+25 phase) plot on the semi-log paper
25 G(s) draw the bode (magnitude and [13] For the system with transfer function s2+4s+25 phase) plot on the semi-log paper
25 G(s) draw the bode (magnitude and [13] For the system with transfer function s2+4s+25 phase) plot on the semi-log paper
Bode Plots Sketch the Bode plot magnitude and phase for each of the three open-loop transfer...
Bode Plots Sketch the Bode plot magnitude and phase for each of the three open-loop transfer functions listed below. Verify your results using the bode m function in MATLAB.(a) \(G(s)=\frac{100}{s(0.1 s+1)(0.01 s+1)}\)(b) \(G(s)=\frac{1}{(s+1)^{2}\left(s^{2}+s+9\right)}\)(c) \(G(s)=\frac{16000 s}{(s+1)(s+100)\left(s^{2}+5 s+1600\right)}\)
Please solve these using matlab Problem 1 Given the transfer functions e S +5 (a) C(s)...
 Please solve these using matlab
Problem 1 Given the transfer functions e S +5 (a) C(s) 20 S + 20 (b) Use the step function to determine the time constant and rise time for each system. Note: estimate these values from the plot and do not use the stepinfo function. Problem 2 Given the transfer function 100 G(S) = 22 +45 + 25 a. Use the plot resulting from the step function in MATLAB to determine the percent overshoot, settling...
Please solve these using matlab
Problem 1 Given the transfer functions e S +5 (a) C(s) 20 S + 20 (b) Use the step function to determine the time constant and rise time for each system. Note: estimate these values from the plot and do not use the stepinfo function. Problem 2 Given the transfer function 100 G(S) = 22 +45 + 25 a. Use the plot resulting from the step function in MATLAB to determine the percent overshoot, settling...
Given the transfer function 4. G(s)H(s) - (s + 8) (s +6s + 13) (a) Sketch the root locus plot using Matlab. (b) Estimate the system gain when the damping ratio is 7 0.707 (c) Add a simple pole, (s...
 Given the transfer function 4. G(s)H(s) - (s + 8) (s +6s + 13) (a) Sketch the root locus plot using Matlab. (b) Estimate the system gain when the damping ratio is 7 0.707 (c) Add a simple pole, (s 2), to G (s)H (s) and examine the resulting root locus (d) Add a simple zero, (s +2), to G(s)H(s) and examine the resulting root locus
Given the transfer function 4. G(s)H(s) - (s + 8) (s +6s + 13)...
Given the transfer function 4. G(s)H(s) - (s + 8) (s +6s + 13) (a) Sketch the root locus plot using Matlab. (b) Estimate the system gain when the damping ratio is 7 0.707 (c) Add a simple pole, (s 2), to G (s)H (s) and examine the resulting root locus (d) Add a simple zero, (s +2), to G(s)H(s) and examine the resulting root locus
Given the transfer function 4. G(s)H(s) - (s + 8) (s +6s + 13)...
I need Summary of this Paper i dont need long summary i need What methodology they used , what is the purpose of this p...
 I need Summary of this Paper i dont need long summary i need
What methodology they used , what is the purpose of this paper and
some conclusions and contributes of this paper. I need this for my
Finishing Project so i need this ASAP please ( IN 1-2-3 HOURS
PLEASE !!!)
Budgetary Policy and Economic Growth Errol D'Souza The share of capital expenditures in government expenditures has been slipping and the tax reforms have not yet improved the income...
I need Summary of this Paper i dont need long summary i need
What methodology they used , what is the purpose of this paper and
some conclusions and contributes of this paper. I need this for my
Finishing Project so i need this ASAP please ( IN 1-2-3 HOURS
PLEASE !!!)
Budgetary Policy and Economic Growth Errol D'Souza The share of capital expenditures in government expenditures has been slipping and the tax reforms have not yet improved the income...
 For each of the transfer functions given below, draw the pole-zero plot and plot the magnitude separate from the phase as a function of frequency. Show only the asymptotic terms that make up the transfer function and then add them to show the composite plot. You can verify your plots (to some extent) by using MATLAB to generate the plots but only as a check that the work you have done is correct. The work that will count for points...
 3. Draw the Bode plot (magnitude and phase) for the transfer function H(s) of a CT LTI given by H(s) 4000 only the asymptotic plot of the terms that make up the transfer function but also show the composite plot that adds all the terms that make up the transfer function. S+2000s+10 where the ROC includes the ja axis. Show
 For each of the following transfer functions, plot the pole-zero pattern, draw curves of M(a) versus ω and θ(a) versus ω, and comment briefly on your results. For the function in part (c), include the numerical values for ω- 9.9, 10.0, and 10.1 rad/s. 2 H(s)= s2+2s +1 a. 2s2 H (s) = 0.25+100 C.
For each of the following transfer functions, plot the pole-zero pattern, draw curves of M(a) versus ω and θ(a) versus ω, and comment briefly on...
For each of the following transfer functions, plot the pole-zero pattern, draw curves of M(a) versus ω and θ(a) versus ω, and comment briefly on your results. For the function in part (c), include the numerical values for ω- 9.9, 10.0, and 10.1 rad/s. 2 H(s)= s2+2s +1 a. 2s2 H (s) = 0.25+100 C.
For each of the following transfer functions, plot the pole-zero pattern, draw curves of M(a) versus ω and θ(a) versus ω, and comment briefly on...
 25 G(s) draw the bode (magnitude and [13] For the system with transfer function s2+4s+25 phase) plot on the semi-log paper
25 G(s) draw the bode (magnitude and [13] For the system with transfer function s2+4s+25 phase) plot on the semi-log paper
25 G(s) draw the bode (magnitude and [13] For the system with transfer function s2+4s+25 phase) plot on the semi-log paper
 Please solve these using matlab
Problem 1 Given the transfer functions e S +5 (a) C(s) 20 S + 20 (b) Use the step function to determine the time constant and rise time for each system. Note: estimate these values from the plot and do not use the stepinfo function. Problem 2 Given the transfer function 100 G(S) = 22 +45 + 25 a. Use the plot resulting from the step function in MATLAB to determine the percent overshoot, settling...
Please solve these using matlab
Problem 1 Given the transfer functions e S +5 (a) C(s) 20 S + 20 (b) Use the step function to determine the time constant and rise time for each system. Note: estimate these values from the plot and do not use the stepinfo function. Problem 2 Given the transfer function 100 G(S) = 22 +45 + 25 a. Use the plot resulting from the step function in MATLAB to determine the percent overshoot, settling...
 Given the transfer function 4. G(s)H(s) - (s + 8) (s +6s + 13) (a) Sketch the root locus plot using Matlab. (b) Estimate the system gain when the damping ratio is 7 0.707 (c) Add a simple pole, (s 2), to G (s)H (s) and examine the resulting root locus (d) Add a simple zero, (s +2), to G(s)H(s) and examine the resulting root locus
Given the transfer function 4. G(s)H(s) - (s + 8) (s +6s + 13)...
Given the transfer function 4. G(s)H(s) - (s + 8) (s +6s + 13) (a) Sketch the root locus plot using Matlab. (b) Estimate the system gain when the damping ratio is 7 0.707 (c) Add a simple pole, (s 2), to G (s)H (s) and examine the resulting root locus (d) Add a simple zero, (s +2), to G(s)H(s) and examine the resulting root locus
Given the transfer function 4. G(s)H(s) - (s + 8) (s +6s + 13)...
 I need Summary of this Paper i dont need long summary i need
What methodology they used , what is the purpose of this paper and
some conclusions and contributes of this paper. I need this for my
Finishing Project so i need this ASAP please ( IN 1-2-3 HOURS
PLEASE !!!)
Budgetary Policy and Economic Growth Errol D'Souza The share of capital expenditures in government expenditures has been slipping and the tax reforms have not yet improved the income...
I need Summary of this Paper i dont need long summary i need
What methodology they used , what is the purpose of this paper and
some conclusions and contributes of this paper. I need this for my
Finishing Project so i need this ASAP please ( IN 1-2-3 HOURS
PLEASE !!!)
Budgetary Policy and Economic Growth Errol D'Souza The share of capital expenditures in government expenditures has been slipping and the tax reforms have not yet improved the income...
Most questions answered within 3 hours.
-
Where is the error in this code sequence?
String s1 = "Hello";
String s2 = "ello";...
asked 11 months ago -
Financial data for Joel de Paris, Inc., for last year
follow:
Joel de Paris, Inc.
Balance...
asked 11 months ago -
Consider this reaction:
Al2(SO4)3 (aq)+ BaCl3
(aq) Al2Cl6 (aq)- +
3BaSO4(s) . What is the...
asked 11 months ago -
Suppose that Savneet is considering increasing her
recent random sample from 20 car rentals to 40...
asked 11 months ago -
Trucks arrive at an unloading terminal at an average rate of 120
per hour.
Trucks arrive...
asked 11 months ago -
Why are methanol and ethanol completely soluble in water while
octanol is not very little soluble....
asked 11 months ago -
A facilities manager at a university reads in a research report
that the mean amount of...
asked 11 months ago -
When the CuSO4 is rehydrated by adding water to the anhydrous
compound, is this an endothermic...
asked 11 months ago -
A ray of sunlight is passing from diamond into crown glass; the
angle of incidence is...
asked 11 months ago -
A block of mass 0.249 kg is placed on top of a light, vertical
spring of...
asked 11 months ago -
how do the kidneys compensate in the presences of acidosis
a) trigger hyperventilate
b) reserve acid...
asked 11 months ago -
Question 501 pts
The rental rate of capital to the firm increases. Which of the
following...
asked 11 months ago