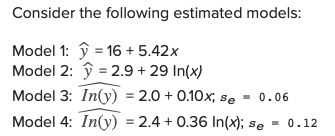

b. For each model, what is the predicted change in y when x increases by 4%, from 10 to 10.47 (Do not round intermediate calculations. Round final answers to 2 decimal places.) units units percent percent. Model 1:y increases Model 2: ý increases Model 3: increases Model 4:y increases by by by by
Homework Answers

Add Answer to:
Consider the following estimated models: Model 1: y-16 + 5.42x Model 2: y-29 + 29 In(x) Model 3: In(y) 2.0+0.10x, se 0.06 Model 4: In(y -2.4+0.36 In(; se 0.12 b. For each model, what is the predicted...
Consider the following estimated models: Model 1: yˆ = 14 + 7.34x Model 2: yˆ= 3.0 + 25...
Consider the following estimated models: Model 1: yˆ = 14 + 7.34x Model 2: yˆ= 3.0 + 25 In(x) Model 3: In(y)ˆ = 2.0 + 0.08x; se = 0.06 Model 4: In(y)ˆ= 2.5 + 0.48 In(x); se = 0.16 a. Interpret the slope coefficient in each of the above estimated models, when x increases by one unit in Models 1 and 3 and by 1% in Models 2 and 4. (Round your answers to 2 decimal places.) increase or decrease Model 1:...
Consider the sample regressions for the linear, the logarithmic, the exponential, and the log-log models. For each of th...
 Consider the sample regressions for the linear, the logarithmic,
the exponential, and the log-log models. For each of the estimated
models, predict y when x equals 50. (Do
not round intermediate calculations. Round final answers to 2
decimal places.)
Response Variable: y
Response Variable: ln(y)
Model 1
Model 2
Model 3
Model 4
Intercept
18.52
−6.74
1.48
1.02
x
1.68
NA
0.06
NA
ln(x)
NA
29.96
NA
0.96
se
23.92
19.71
0.12
0.10
Model 1 Model 2 Model 3 Model...
Consider the sample regressions for the linear, the logarithmic,
the exponential, and the log-log models. For each of the estimated
models, predict y when x equals 50. (Do
not round intermediate calculations. Round final answers to 2
decimal places.)
Response Variable: y
Response Variable: ln(y)
Model 1
Model 2
Model 3
Model 4
Intercept
18.52
−6.74
1.48
1.02
x
1.68
NA
0.06
NA
ln(x)
NA
29.96
NA
0.96
se
23.92
19.71
0.12
0.10
Model 1 Model 2 Model 3 Model...
Consider the sample regressions for the linear (Model 1), the logarithmic (Model 2), the exponential (Model...
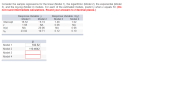 Consider the sample regressions for the linear (Model 1), the logarithmic (Model 2), the exponential (Model 3), and the log-log (Model 4) models. For each of the estimated models, predict y when x equals 50. (Do not round intermediate calculations. Round your answers to 2 decimal places.) Response Variable: y Response Variable: In(y) Model 18.52 1.68 NA 23.92 Model 2 -6.74 NA 29.96 19.71 Model 3 1.48 0.06 NA 0.12 Model 4 1.02 NA 0.96 0.10 Intercept In(x) 102.52 Model...
Consider a binary response variable y and two explanatory variables xy and x2. The following table contains the parameter estimates of the linear probability model (LPM) and the logit model, wit...
 Consider a binary response variable y and two explanatory variables xy and x2. The following table contains the parameter estimates of the linear probability model (LPM) and the logit model, with the associated p-values shown in parentheses. Constant .40 -2.30 x1 x2 0.06 (0.03) 0.36 0.90 (0.03)(0.07) -0.03-0.10 (0.02) (0.01) a. At the 5% significance level, comment on the significance of the variables for both models. Logit gnificant 0 (Not significant x1 x2 b. What is the predicted probability implied...
Consider the following estimated trend models. Use them to make a forecast for t= 24. a....
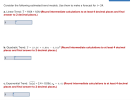 Consider the following estimated trend models. Use them to make a forecast for t= 24. a. Linear Trend: = 11.64 + 1.04t (Round intermediate calculations to at least 4 decimal places and final answer to 2 decimal places.) Ў b. Quadratic Trend: û = 19.26 + 0.88t - 0.0172 (Round intermediate calculations to at least 4 decimal places and final answer to 2 decimal places.) 9 c. Exponential Trend: In(y) = 2.4 +0.06t, se = 0.01 (Round intermediate calculations to...
7 Consider the following regression output involving the variables y and, rı, r2. (note log is the natural logarithm as usual) 4.12 0.88 r Model A: Model B: log(y)0.34 0.14 + 0.001 2 Model C: logly)2...
 7 Consider the following regression output involving the variables y and, rı, r2. (note log is the natural logarithm as usual) 4.12 0.88 r Model A: Model B: log(y)0.34 0.14 + 0.001 2 Model C: logly)2011.4 log()0.02 r2 0.06 Model D: Model E: y = 5.4 + 0.82i --3.4 55.1 log(0.020 2 + 1.2r2 0.2 (1x2) Ceteris Paribus: (a) In Model A: If x1 increases 6 to 8 by 2 units, then the predicted change in y is Δy =...
Consider the following sample regressions for the linear, the quadratic, and the cubic models along with...
 Consider the following sample regressions for the linear, the quadratic, and the cubic models along with their respective R2 and adjusted R2. Intercept х x2 Linear 28.53 0.12 NA NA Quadratic 28.80 0.01 0.01 Cubic 28.62 0.15 -0.02 -0.01 x3 NA R2 Adjusted R2 0.005 -0.021 0.006 -0.048 0.006 -0.077 a. Predict y for x = 2 and 4 with each of the estimated models. (Round intermediate calculations to at least 4 decimal places and final answers to 2 decimal...
Returns Year X Y 1 14 % 18% 2 28 29 0.41 3 10 points -...
 Returns Year X Y 1 14 % 18% 2 28 29 0.41 3 10 points - 21 4 -26 5 10 20 еВook Print Using the returns shown above, calculate the arithmetic average returns, the variances, and the standard deviations for X and Y. (Do not round intermediate calculations. Enter your average return and standard deviation as a percent rounded to 2 decimal places, e.g., 32.16, and round the variance to 5 decimal places, e.g., 32.16161.) References X Y Average...
Returns Year X Y 1 13% 18% 2 27 28 3 - 20 - 25 4...
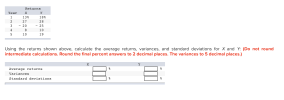 Returns Year X Y 1 13% 18% 2 27 28 3 - 20 - 25 4 8 10 5 10 19 Using the returns shown above, calculate the average returns, variances, and standard deviations for X and Y: (Do not round intermediate calculations. Round the final percent answers to 2 decimal places. The variances to 5 decimal places.) X Y Average returns Variances Standard deviations ОО
The following sample observations were randomly selected: 1 2 3 4 5 X: 17 4 2...
The following sample observations were randomly selected: 1 2 3 4 5 X: 17 4 2 7 6 Y: 13 25 6 15 15 a. Determine the regression equation. (Negative answer should be indicated by a minus sign. Do not round intermediate calculations. Round the final answers to 4 decimal places.) b = a = Y' = + X b. Determine the value of Y' when X is 13. (Do not round intermediate calculations. Round the final...
 Consider the sample regressions for the linear, the logarithmic,
the exponential, and the log-log models. For each of the estimated
models, predict y when x equals 50. (Do
not round intermediate calculations. Round final answers to 2
decimal places.)
Response Variable: y
Response Variable: ln(y)
Model 1
Model 2
Model 3
Model 4
Intercept
18.52
−6.74
1.48
1.02
x
1.68
NA
0.06
NA
ln(x)
NA
29.96
NA
0.96
se
23.92
19.71
0.12
0.10
Model 1 Model 2 Model 3 Model...
Consider the sample regressions for the linear, the logarithmic,
the exponential, and the log-log models. For each of the estimated
models, predict y when x equals 50. (Do
not round intermediate calculations. Round final answers to 2
decimal places.)
Response Variable: y
Response Variable: ln(y)
Model 1
Model 2
Model 3
Model 4
Intercept
18.52
−6.74
1.48
1.02
x
1.68
NA
0.06
NA
ln(x)
NA
29.96
NA
0.96
se
23.92
19.71
0.12
0.10
Model 1 Model 2 Model 3 Model...
 Consider the sample regressions for the linear (Model 1), the logarithmic (Model 2), the exponential (Model 3), and the log-log (Model 4) models. For each of the estimated models, predict y when x equals 50. (Do not round intermediate calculations. Round your answers to 2 decimal places.) Response Variable: y Response Variable: In(y) Model 18.52 1.68 NA 23.92 Model 2 -6.74 NA 29.96 19.71 Model 3 1.48 0.06 NA 0.12 Model 4 1.02 NA 0.96 0.10 Intercept In(x) 102.52 Model...
 Consider a binary response variable y and two explanatory variables xy and x2. The following table contains the parameter estimates of the linear probability model (LPM) and the logit model, with the associated p-values shown in parentheses. Constant .40 -2.30 x1 x2 0.06 (0.03) 0.36 0.90 (0.03)(0.07) -0.03-0.10 (0.02) (0.01) a. At the 5% significance level, comment on the significance of the variables for both models. Logit gnificant 0 (Not significant x1 x2 b. What is the predicted probability implied...
 Consider the following estimated trend models. Use them to make a forecast for t= 24. a. Linear Trend: = 11.64 + 1.04t (Round intermediate calculations to at least 4 decimal places and final answer to 2 decimal places.) Ў b. Quadratic Trend: û = 19.26 + 0.88t - 0.0172 (Round intermediate calculations to at least 4 decimal places and final answer to 2 decimal places.) 9 c. Exponential Trend: In(y) = 2.4 +0.06t, se = 0.01 (Round intermediate calculations to...
 7 Consider the following regression output involving the variables y and, rı, r2. (note log is the natural logarithm as usual) 4.12 0.88 r Model A: Model B: log(y)0.34 0.14 + 0.001 2 Model C: logly)2011.4 log()0.02 r2 0.06 Model D: Model E: y = 5.4 + 0.82i --3.4 55.1 log(0.020 2 + 1.2r2 0.2 (1x2) Ceteris Paribus: (a) In Model A: If x1 increases 6 to 8 by 2 units, then the predicted change in y is Δy =...
 Consider the following sample regressions for the linear, the quadratic, and the cubic models along with their respective R2 and adjusted R2. Intercept х x2 Linear 28.53 0.12 NA NA Quadratic 28.80 0.01 0.01 Cubic 28.62 0.15 -0.02 -0.01 x3 NA R2 Adjusted R2 0.005 -0.021 0.006 -0.048 0.006 -0.077 a. Predict y for x = 2 and 4 with each of the estimated models. (Round intermediate calculations to at least 4 decimal places and final answers to 2 decimal...
 Returns Year X Y 1 14 % 18% 2 28 29 0.41 3 10 points - 21 4 -26 5 10 20 еВook Print Using the returns shown above, calculate the arithmetic average returns, the variances, and the standard deviations for X and Y. (Do not round intermediate calculations. Enter your average return and standard deviation as a percent rounded to 2 decimal places, e.g., 32.16, and round the variance to 5 decimal places, e.g., 32.16161.) References X Y Average...
 Returns Year X Y 1 13% 18% 2 27 28 3 - 20 - 25 4 8 10 5 10 19 Using the returns shown above, calculate the average returns, variances, and standard deviations for X and Y: (Do not round intermediate calculations. Round the final percent answers to 2 decimal places. The variances to 5 decimal places.) X Y Average returns Variances Standard deviations ОО
Most questions answered within 3 hours.
-
Where is the error in this code sequence?
String s1 = "Hello";
String s2 = "ello";...
asked 11 months ago -
Financial data for Joel de Paris, Inc., for last year
follow:
Joel de Paris, Inc.
Balance...
asked 11 months ago -
Consider this reaction:
Al2(SO4)3 (aq)+ BaCl3
(aq) Al2Cl6 (aq)- +
3BaSO4(s) . What is the...
asked 11 months ago -
Suppose that Savneet is considering increasing her
recent random sample from 20 car rentals to 40...
asked 11 months ago -
Trucks arrive at an unloading terminal at an average rate of 120
per hour.
Trucks arrive...
asked 11 months ago -
Why are methanol and ethanol completely soluble in water while
octanol is not very little soluble....
asked 11 months ago -
A facilities manager at a university reads in a research report
that the mean amount of...
asked 11 months ago -
When the CuSO4 is rehydrated by adding water to the anhydrous
compound, is this an endothermic...
asked 11 months ago -
A ray of sunlight is passing from diamond into crown glass; the
angle of incidence is...
asked 11 months ago -
A block of mass 0.249 kg is placed on top of a light, vertical
spring of...
asked 11 months ago -
how do the kidneys compensate in the presences of acidosis
a) trigger hyperventilate
b) reserve acid...
asked 11 months ago -
Question 501 pts
The rental rate of capital to the firm increases. Which of the
following...
asked 11 months ago