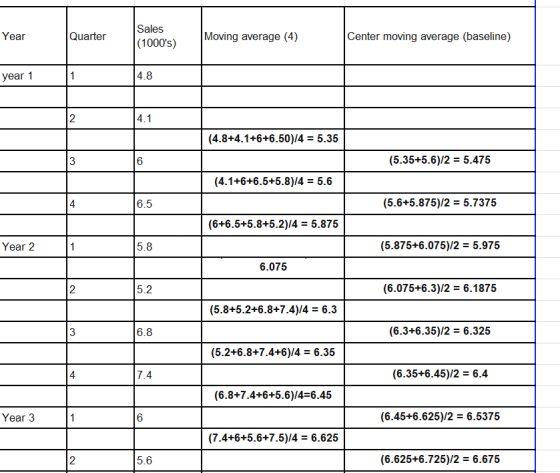
1. Fill out the two column (Moving average 4 cells) 2. and the center moving average Quarter Data for Car Sales Year Quarter Sales (1000's) Moving average (4) Center moving average (ba...
| 1. Fill out the two column (Moving average 4 cells) | ||||
| 2. and the center moving average | ||||
| Quarter Data for Car Sales | ||||
| Year | Quarter | Sales (1000's) | Moving average (4) | Center moving average (baseline) |
| year 1 | 1 | 4.8 | ||
| 2 | 4.1 | |||
| 3 | 6 | |||
| 4 | 6.5 | |||
| Year 2 | 1 | 5.8 | ||
| 2 | 5.2 | |||
| 3 | 6.8 | |||
| 4 | 7.4 | |||
| Year 3 | 1 | 6 | ||
| 2 | 5.6 | |||
| 3 | 7.5 | |||
| 4 | 7.8 | |||
| Year 4 | 1 | 6.3 | ||
| 2 | 5.9 | |||
| 3 | 8 | |||
| 4 | 8.4 | |||
Homework Answers

Add Answer to:
1. Fill out the two column (Moving average 4 cells) 2. and the center moving average Quarter Data for Car Sales Year Quarter Sales (1000's) Moving average (4) Center moving average (ba...
1. Graph three plots Sales, Forecast, center moving average 2. Predict the sales in year 5 for each quarter using forecasting Quarter Data for Car Sales |Sales (1000%) 4.8 4.1 |Quarter Cent...
 1. Graph three plots Sales, Forecast, center moving average 2. Predict the sales in year 5 for each quarter using forecasting Quarter Data for Car Sales |Sales (1000%) 4.8 4.1 |Quarter Center moving average (baseline) Moving average (4) Year year 11 6.5 5.8 5.2 6.8 7.4 Year 21 Year 3 5.6 7.5 7.8 6.3 5.9 Year 4 1 8.4 1. Fill out the two column (Moving average 4 cells) 2. and the center moving average Quarter Data for Car Sales...
You can click to download the file attached activity 4 Graph three plots.docx 1. Fill out the two column (Moving average 4 cells) 2. and the center moving average Quarter Data for Car Sales Movin...
 You can click to download the file attached activity 4 Graph three plots.docx 1. Fill out the two column (Moving average 4 cells) 2. and the center moving average Quarter Data for Car Sales Moving average Center moving average Sales Quarter (1000s) 4.8 4.1 Year (baseline year 11 6.5 5.8 5.2 6.8 7.4 4 Year 2 1 3 4 Year 3 5.6 7.5 7.8 6.3 5.9 Year 4 4 8.4 Attach File
You can click to download the file attached...
You can click to download the file attached activity 4 Graph three plots.docx 1. Fill out the two column (Moving average 4 cells) 2. and the center moving average Quarter Data for Car Sales Moving average Center moving average Sales Quarter (1000s) 4.8 4.1 Year (baseline year 11 6.5 5.8 5.2 6.8 7.4 4 Year 2 1 3 4 Year 3 5.6 7.5 7.8 6.3 5.9 Year 4 4 8.4 Attach File
You can click to download the file attached...
Exercise 1. Graph three plots Sales, Forecast, center moving average 2. Predict the sales in year...
Exercise 1. Graph three plots Sales, Forecast, center moving average 2. Predict the sales in year 5 for each quarter using forecasting Quarter Data for Car Sales Year Quarter Sales (1000's) Moving average (4) Center moving average (baseline) year 1 1 4.8 2 4.1 3 6 4 6.5 Year 2 1 5.8 2 5.2 3 6.8 4 7.4 Year 3 1 6 2 5.6 3 7.5 4 7.8 Year 4 1 6.3 2 5.9 3 8 4 8.4
Q4 A and B Year 1 1 2 3 4 5.2 Q4. The following data show...
 Q4
A and B
Year 1 1 2 3 4 5.2 Q4. The following data show the quarterly sales of Amazing Graphics, Inc. for the years 1 through 3. Quarter Time Period (0) Sales (1000s) 4.8 2 4.1 3 6.0 4 6.5 2 5 5.8 2 6 2 3 7 6.8 2 4 8 7.4 9 6.0 3 2 10 5.6 3 3 11 7.5 3 4 12 8.8 From the above data, it could be concluded that both quarterly...
Q4
A and B
Year 1 1 2 3 4 5.2 Q4. The following data show the quarterly sales of Amazing Graphics, Inc. for the years 1 through 3. Quarter Time Period (0) Sales (1000s) 4.8 2 4.1 3 6.0 4 6.5 2 5 5.8 2 6 2 3 7 6.8 2 4 8 7.4 9 6.0 3 2 10 5.6 3 3 11 7.5 3 4 12 8.8 From the above data, it could be concluded that both quarterly...
Parametirc test or not: Test statistic: p-value: decision: Is There A Difference Between the Means?
Parametirc test or not:Test statistic:p-value:decision:Is There A Difference Between the Means?6.7 6.2 3.1 310.3 10 5 5.56.9 5.5 3.3 3.110.5 6.3 4.3 5.44.5 4.6 1.8 25.6 5.6 2 2.65.9 6.1 2.1 2.58 11.7 4 4.68 7.4 3.3 3.15.8 5.2 3.1 2.96 7.3 3.0 3.28.7 5.3 2.7 36 5.5 2.1 2.27.2 6.3 3.5 3.25.9 4.6 2.9 3.46 7.4 3 3.37.2 7.8 3.7 3.48.6 9.4 5.1 5.77.2 8.1 2.8 3.15.8 5.4 2.2 1.83.3 4 1.7 1.86.8 5.1 2 1.83.7 3.5 2.2 2.112...
The data on the below shows the number of hours a particular drug is in the...
The data on the below shows the number of hours a particular drug is in the system of 200 females. Develop a histogram of this data according to the following intervals: Follow the directions. Test the hypothesis that these data are distributed exponentially. Determine the test statistic. Round to two decimal places. (sort the data first) [0, 3) [3, 6) [6, 9) [9, 12) [12, 18) [18, 24) [24, infinity) 34.7 11.8 10 7.8 2.8 20 9.8 20.4 1.2 7.2...
Q6 3 4 91 Q6. The following data show the quarterly sales of Amazing Graphics, Inc....
 Q6
3 4 91 Q6. The following data show the quarterly sales of Amazing Graphics, Inc. for the years 1 through 3. Year Quarter Time Period (t) Sales (1000s) 1 2 4.1 6.0 6.5 5.8 5.2 6.8 7.4 3 6.0 510 5.6 13 3 117.5 13 128.8 From the above data, it could be concluded that both quarterly seasonal effects and linear trend in the sales pattern are present. A time series model was considered for this question and the...
Q6
3 4 91 Q6. The following data show the quarterly sales of Amazing Graphics, Inc. for the years 1 through 3. Year Quarter Time Period (t) Sales (1000s) 1 2 4.1 6.0 6.5 5.8 5.2 6.8 7.4 3 6.0 510 5.6 13 3 117.5 13 128.8 From the above data, it could be concluded that both quarterly seasonal effects and linear trend in the sales pattern are present. A time series model was considered for this question and the...
A comparison was made of the average length of stay (in days) for the years 2000,...
A comparison was made of the average length of stay (in days) for the years 2000, 2005, 2010, and 2015 between males and females (ages 45–64) for seven diagnoses. The data indicates: 2000 2005 2010 2015 Males: Malignant Neoplasm 9.2 9.4 8.2 7.0 Diabetes Mellitus 7.9 7.3 6.6 6.5 Diseases of the Heart 6.5 5.8 5.0 4.8 Cerebrovascular disease 10.2 10.0 6.2 6.8 Pneumonia 8.0 7.9 7.2 6.9 Injuries and poisoning 6.6 7.2 5.8 5.5 Fractures 7.5 7.2 6.7 6.3...
1) Calculate the exact 95% and 99% confidence intervals for a variable with these data: 82,...
1) Calculate the exact 95% and 99% confidence intervals for a variable with these data: 82, 72, 106, 46, 82, 59, 54, 74 2) These numbers are measurements of the left and right claw length (cm) from 8 crabs. On average, is left claw length different from right claw length? Crab_ID Left Right 1 7.0 7.1 2 6.3 6.5 3 6.1 6.8 4 6.1 6.4 5 6.3 6.4 6 7.0 7.4 7 5.8 5.6 8 6.0 6.5
An object of weight 1 N is falling vertically. The time vs. speed data can be...
An object of weight 1 N is falling vertically. The time vs. speed data can be found here. In this case the effect of air-drag cannot be neglected. Use your critical thinking to estimate the air-drag coefficient . Make sure you include the units in your answer. 0 0 0.1 0.9992 0.2 1.993 0.3 2.978 0.4 3.948 0.5 4.898 0.6 5.826 0.7 6.728 0.8 7.599 0.9 8.438 1 9.242 1.1 10.01 1.2 10.74 1.3 11.43 1.4 12.09 1.5 12.7 1.6 ...
 1. Graph three plots Sales, Forecast, center moving average 2. Predict the sales in year 5 for each quarter using forecasting Quarter Data for Car Sales |Sales (1000%) 4.8 4.1 |Quarter Center moving average (baseline) Moving average (4) Year year 11 6.5 5.8 5.2 6.8 7.4 Year 21 Year 3 5.6 7.5 7.8 6.3 5.9 Year 4 1 8.4 1. Fill out the two column (Moving average 4 cells) 2. and the center moving average Quarter Data for Car Sales...
 You can click to download the file attached activity 4 Graph three plots.docx 1. Fill out the two column (Moving average 4 cells) 2. and the center moving average Quarter Data for Car Sales Moving average Center moving average Sales Quarter (1000s) 4.8 4.1 Year (baseline year 11 6.5 5.8 5.2 6.8 7.4 4 Year 2 1 3 4 Year 3 5.6 7.5 7.8 6.3 5.9 Year 4 4 8.4 Attach File
You can click to download the file attached...
You can click to download the file attached activity 4 Graph three plots.docx 1. Fill out the two column (Moving average 4 cells) 2. and the center moving average Quarter Data for Car Sales Moving average Center moving average Sales Quarter (1000s) 4.8 4.1 Year (baseline year 11 6.5 5.8 5.2 6.8 7.4 4 Year 2 1 3 4 Year 3 5.6 7.5 7.8 6.3 5.9 Year 4 4 8.4 Attach File
You can click to download the file attached...
 Q4
A and B
Year 1 1 2 3 4 5.2 Q4. The following data show the quarterly sales of Amazing Graphics, Inc. for the years 1 through 3. Quarter Time Period (0) Sales (1000s) 4.8 2 4.1 3 6.0 4 6.5 2 5 5.8 2 6 2 3 7 6.8 2 4 8 7.4 9 6.0 3 2 10 5.6 3 3 11 7.5 3 4 12 8.8 From the above data, it could be concluded that both quarterly...
Q4
A and B
Year 1 1 2 3 4 5.2 Q4. The following data show the quarterly sales of Amazing Graphics, Inc. for the years 1 through 3. Quarter Time Period (0) Sales (1000s) 4.8 2 4.1 3 6.0 4 6.5 2 5 5.8 2 6 2 3 7 6.8 2 4 8 7.4 9 6.0 3 2 10 5.6 3 3 11 7.5 3 4 12 8.8 From the above data, it could be concluded that both quarterly...
 Q6
3 4 91 Q6. The following data show the quarterly sales of Amazing Graphics, Inc. for the years 1 through 3. Year Quarter Time Period (t) Sales (1000s) 1 2 4.1 6.0 6.5 5.8 5.2 6.8 7.4 3 6.0 510 5.6 13 3 117.5 13 128.8 From the above data, it could be concluded that both quarterly seasonal effects and linear trend in the sales pattern are present. A time series model was considered for this question and the...
Q6
3 4 91 Q6. The following data show the quarterly sales of Amazing Graphics, Inc. for the years 1 through 3. Year Quarter Time Period (t) Sales (1000s) 1 2 4.1 6.0 6.5 5.8 5.2 6.8 7.4 3 6.0 510 5.6 13 3 117.5 13 128.8 From the above data, it could be concluded that both quarterly seasonal effects and linear trend in the sales pattern are present. A time series model was considered for this question and the...
Most questions answered within 3 hours.
-
Where is the error in this code sequence?
String s1 = "Hello";
String s2 = "ello";...
asked 10 months ago -
Financial data for Joel de Paris, Inc., for last year
follow:
Joel de Paris, Inc.
Balance...
asked 10 months ago -
Consider this reaction:
Al2(SO4)3 (aq)+ BaCl3
(aq) Al2Cl6 (aq)- +
3BaSO4(s) . What is the...
asked 10 months ago -
Suppose that Savneet is considering increasing her
recent random sample from 20 car rentals to 40...
asked 10 months ago -
Trucks arrive at an unloading terminal at an average rate of 120
per hour.
Trucks arrive...
asked 10 months ago -
Why are methanol and ethanol completely soluble in water while
octanol is not very little soluble....
asked 10 months ago -
A facilities manager at a university reads in a research report
that the mean amount of...
asked 10 months ago -
When the CuSO4 is rehydrated by adding water to the anhydrous
compound, is this an endothermic...
asked 10 months ago -
A ray of sunlight is passing from diamond into crown glass; the
angle of incidence is...
asked 10 months ago -
A block of mass 0.249 kg is placed on top of a light, vertical
spring of...
asked 10 months ago -
how do the kidneys compensate in the presences of acidosis
a) trigger hyperventilate
b) reserve acid...
asked 10 months ago -
Question 501 pts
The rental rate of capital to the firm increases. Which of the
following...
asked 10 months ago