

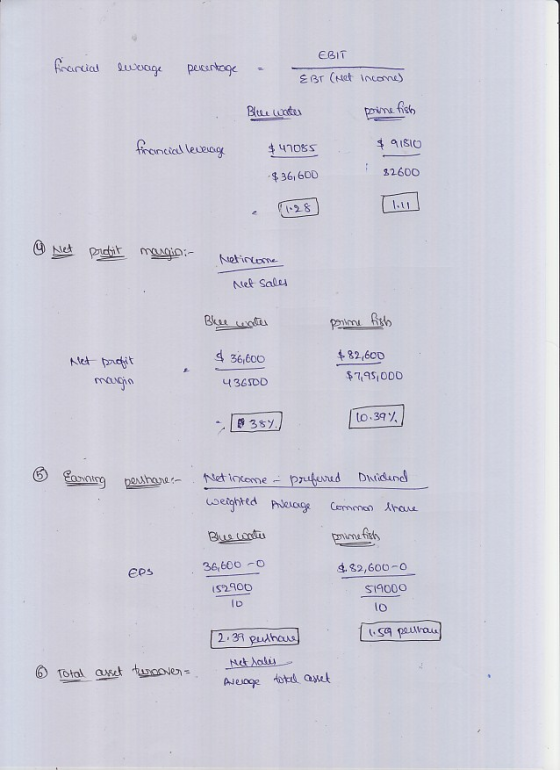
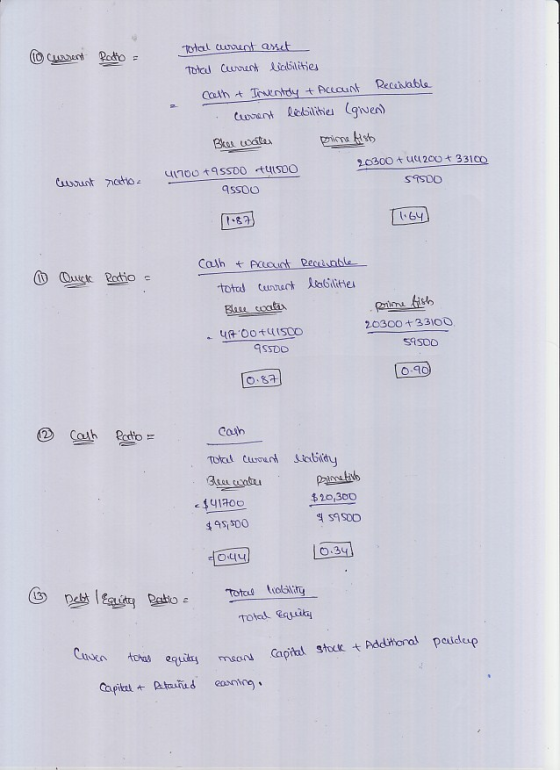
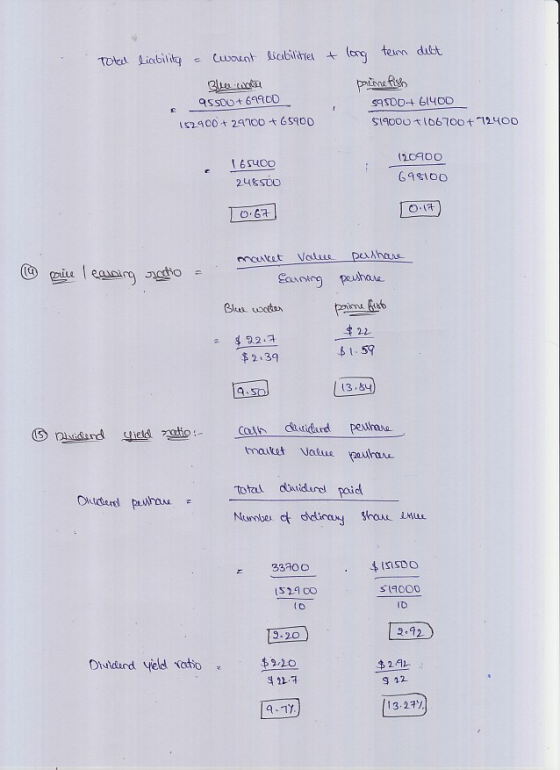
BLUE WATER COMPANY PRIME FISH COMPANY Ratio Profitability ratios: Return on equity Return on assets Financial leverage percentage Net profit margin Earnings per share 2. Turnover ratios: Total asset turnover Fixed asset turnover Receivable turnover Inventory turnover 9 Liquidity ratios 10 Current ratio Quick ratio 12. Cash ratio Solvency ratios 13. Debt/equity ratio Market ratios 14 Pricelearnings ratic 15. Dividend yield ratio
Homework Answers


Add Answer to:
The current year financial statements for Blue Water Company and Prime Fish Company are presented below. Blue Water Prime Fish Balance sheet: Cash Accounts receivable (net) Inventory Property &e...
The current year financial statements for Blue Water Company and Prime Fish Company are presented below....
 The current year financial statements for Blue Water Company and Prime Fish Company are presented below. Blue Water Prime Fish Balance sheet: Cash Accounts receivable (net) Inventory Property & equipment (net) Other assets Total assets Current liabilities Long-term debt (interest rate: 10%) Capital stock $10 par value) Additional paid-in capital Retained earnings Total liabilities and stockholders' equity Income statement: Sales revenue (1/3 on credit) Cost of goods sold Operating expenses Net income Other data: Per share stock price at end...
The current year financial statements for Blue Water Company and Prime Fish Company are presented below....
 The current year financial statements for Blue Water Company and Prime Fish Company are presented below. Blue Water Prime Fish Balance sheet: Cash Accounts receivable (net) Inventory Property & equipment (net) Other assets Total assets 21,000 31,000 40,000 401,000 305,000 $ 798,000 49,000 60,000 512,000 106,000 71,000 $ 798,000 $ 41,000 38,000 99,000 140,000 84,000 $ 402,000 99,000 65,000 148,000 29,000 61,000 $ 402,000 $ Current liabilities $ Long-term debt (interest rate: 10%) Capital stock ($10 par value) Additional paid-in...
I created a schedule of the ratio analysis with the information given. I am missing three...
 I created a schedule of the ratio analysis with the information
given. I am missing three ratios. I need to show work and find:
'Quality of Income' and
'Times interest earned ratio' and
'cash coverage ratio'. Use the photos to
help find those three ratios.
Blue Water Prime Fish Balance sheet: $ 42,100 $ Cash Accounts receivable (net) 19,900 34,300 43,500 Inventory 93,500 46,600 156,500 414,200 Property & equipment (net) Other assets 85,100 316,000 Total assets $ 831,000 $ 420,700...
I created a schedule of the ratio analysis with the information
given. I am missing three ratios. I need to show work and find:
'Quality of Income' and
'Times interest earned ratio' and
'cash coverage ratio'. Use the photos to
help find those three ratios.
Blue Water Prime Fish Balance sheet: $ 42,100 $ Cash Accounts receivable (net) 19,900 34,300 43,500 Inventory 93,500 46,600 156,500 414,200 Property & equipment (net) Other assets 85,100 316,000 Total assets $ 831,000 $ 420,700...
Question 32 Balance sheet Cash &n
Question 32 Balance sheet Cash $41,000 $21,000 Account receivable (net) 38,000 31,000 Inventory 99,000 40,000 Property & equipment 140,000 401,000 Other assets 84,000 305,000 Total assets $402,000 $798,000 Current liabilities $ 99,000 $49,000 Long term debt (interest rate: 10%) 65,000 60,000 Capital stock ($10 per value) 148,000 512,000 Additional paid in capital 29,000 106,000 Retainined earning 61,000 71,000 Total liabilities and stockholders equity $402,000 $798,000 Income Statement Sales revenue (1/3 on credit) $447,000 $802,000 Cost of goods sold (241,000 (400,000)...
ORIOLE COMPANY Balance Sheets December 31 2017 2016 Current assets Cash and cash equivalents Accounts receivable...
 ORIOLE COMPANY Balance Sheets December 31 2017 2016 Current assets Cash and cash equivalents Accounts receivable (net) $330 660 600 $360 590 530 Inventory Prepaid expenses 120 160 Total current assets 1,710 1,640 Investments 200 200 Property, plant, and equipment (net) Intangibles and other assets Total assets 420 380 530 510 $2,860 $2,730 $1,090 $980 550 520 Current liabilities Long-term liabilities Stockholders' equity-common Total liabilities and stockholders' equity 1,220 1,230 $2,860 $2,730 ORIOLE COMPANY Income Statements For the Year Ended...
Castile Products, Inc. Balance Sheet December 31 Assets Current assets: Cash Accounts receivable, net Merchandise inventory...
 Castile Products, Inc. Balance Sheet December 31 Assets Current assets: Cash Accounts receivable, net Merchandise inventory Prepaid expenses Total current assets Property and equipment, net Total assets Liabilities and Stockholders' Equity Liabilities: Current liabilities Bonds payable, 10% Total liabilities Stockholders' equity: Common stock, $5 per value Retained earnings Total stockholders' equity Total liabilities and stockholders' equity $ 6,500 35,000 70,000 3,500 115,000 185,000 $300,000 $ 50,000 80,000 130,000 30,000 140,000 170,000 $300,000 Castile Products, Inc. Income Statement For the Year...
Thor Company Gunnar Company Balance Sheet Cash $ 36,000 $ 33,000 Accounts Receivable, Net 78,000 29,000...
 Thor
Company
Gunnar
Company
Balance Sheet
Cash
$
36,000
$
33,000
Accounts Receivable, Net
78,000
29,000
Inventory
156,000
32,000
Equipment, Net
772,000
194,000
Other Assets
197,000
69,400
Total Assets
$
1,239,000
$
357,400
Current Liabilities
$
170,000
$
20,000
Note Payable (long-term) (12% interest rate)
268,000
68,000
Common Stock (par $20)
673,000
253,000
Additional Paid-in Capital
71,000
5,800
Retained Earnings
57,000
10,600
Total Liabilities and Stockholders’ Equity
$
1,239,000
$
357,400
Income Statement
Sales Revenue
$
1,123,000
$
339,000
Cost...
Thor
Company
Gunnar
Company
Balance Sheet
Cash
$
36,000
$
33,000
Accounts Receivable, Net
78,000
29,000
Inventory
156,000
32,000
Equipment, Net
772,000
194,000
Other Assets
197,000
69,400
Total Assets
$
1,239,000
$
357,400
Current Liabilities
$
170,000
$
20,000
Note Payable (long-term) (12% interest rate)
268,000
68,000
Common Stock (par $20)
673,000
253,000
Additional Paid-in Capital
71,000
5,800
Retained Earnings
57,000
10,600
Total Liabilities and Stockholders’ Equity
$
1,239,000
$
357,400
Income Statement
Sales Revenue
$
1,123,000
$
339,000
Cost...
The balance sheet and income statement for Covid19 Bhd is presented below. BALANCE SHEET (000) Cash...
The balance sheet and income statement for Covid19 Bhd is presented below. BALANCE SHEET (000) Cash $ 500 Accounts receivable 1,500 Inventories 500 Current assets 2,500 Net fixed assets 5,000 Total Assets $ 7,500 Accounts payable 1,200 Bank note 300 Total current liabilities 1,500 Long term debt 4,000 Common stock 300 Retained earnings 1,700 Total liabilities and owner's equity $ 7,500 INCOME STATEMENT (000) Net sales $ 8,500 Cost of goods sold (3,400) Gross profit 5,100 Operating expenses (2,900) Net...
US Republic Corporation balance sheet, December 31, 20X3 ASSETS Cash Accounts receivable Inventory Fixed assets, net...
US Republic Corporation balance sheet, December 31, 20X3 ASSETS Cash Accounts receivable Inventory Fixed assets, net Total assets LIABILITIES AND SHAREHOLDERS’ EQUITY $ 1,000,000 5,000,000 7,000,000 17,000,000 $30,000,000 Notes payable, bank Accounts payable Accrued wages and taxes Long-term debt Preferred stock Common stock Retained earnings Total liabilities and shareholders’ equity $ 4,000,000 2,000,000 2,000,000 12,000,000 4,000,000 2,000,000 4,000,000 $30,000,000 $16,000,000 4,000,000 $20,000,000 $16,800,000 $ 3,200,000 1,200,000 $ 2,000,000 240,000 $ 1,760,000 2,600,000 $ 4,360,000 360,000 $ 4,000,000 INDUSTRY NORMS 225%...
 The current year financial statements for Blue Water Company and Prime Fish Company are presented below. Blue Water Prime Fish Balance sheet: Cash Accounts receivable (net) Inventory Property & equipment (net) Other assets Total assets Current liabilities Long-term debt (interest rate: 10%) Capital stock $10 par value) Additional paid-in capital Retained earnings Total liabilities and stockholders' equity Income statement: Sales revenue (1/3 on credit) Cost of goods sold Operating expenses Net income Other data: Per share stock price at end...
 The current year financial statements for Blue Water Company and Prime Fish Company are presented below. Blue Water Prime Fish Balance sheet: Cash Accounts receivable (net) Inventory Property & equipment (net) Other assets Total assets 21,000 31,000 40,000 401,000 305,000 $ 798,000 49,000 60,000 512,000 106,000 71,000 $ 798,000 $ 41,000 38,000 99,000 140,000 84,000 $ 402,000 99,000 65,000 148,000 29,000 61,000 $ 402,000 $ Current liabilities $ Long-term debt (interest rate: 10%) Capital stock ($10 par value) Additional paid-in...
 I created a schedule of the ratio analysis with the information
given. I am missing three ratios. I need to show work and find:
'Quality of Income' and
'Times interest earned ratio' and
'cash coverage ratio'. Use the photos to
help find those three ratios.
Blue Water Prime Fish Balance sheet: $ 42,100 $ Cash Accounts receivable (net) 19,900 34,300 43,500 Inventory 93,500 46,600 156,500 414,200 Property & equipment (net) Other assets 85,100 316,000 Total assets $ 831,000 $ 420,700...
I created a schedule of the ratio analysis with the information
given. I am missing three ratios. I need to show work and find:
'Quality of Income' and
'Times interest earned ratio' and
'cash coverage ratio'. Use the photos to
help find those three ratios.
Blue Water Prime Fish Balance sheet: $ 42,100 $ Cash Accounts receivable (net) 19,900 34,300 43,500 Inventory 93,500 46,600 156,500 414,200 Property & equipment (net) Other assets 85,100 316,000 Total assets $ 831,000 $ 420,700...
 ORIOLE COMPANY Balance Sheets December 31 2017 2016 Current assets Cash and cash equivalents Accounts receivable (net) $330 660 600 $360 590 530 Inventory Prepaid expenses 120 160 Total current assets 1,710 1,640 Investments 200 200 Property, plant, and equipment (net) Intangibles and other assets Total assets 420 380 530 510 $2,860 $2,730 $1,090 $980 550 520 Current liabilities Long-term liabilities Stockholders' equity-common Total liabilities and stockholders' equity 1,220 1,230 $2,860 $2,730 ORIOLE COMPANY Income Statements For the Year Ended...
 Castile Products, Inc. Balance Sheet December 31 Assets Current assets: Cash Accounts receivable, net Merchandise inventory Prepaid expenses Total current assets Property and equipment, net Total assets Liabilities and Stockholders' Equity Liabilities: Current liabilities Bonds payable, 10% Total liabilities Stockholders' equity: Common stock, $5 per value Retained earnings Total stockholders' equity Total liabilities and stockholders' equity $ 6,500 35,000 70,000 3,500 115,000 185,000 $300,000 $ 50,000 80,000 130,000 30,000 140,000 170,000 $300,000 Castile Products, Inc. Income Statement For the Year...
 Thor
Company
Gunnar
Company
Balance Sheet
Cash
$
36,000
$
33,000
Accounts Receivable, Net
78,000
29,000
Inventory
156,000
32,000
Equipment, Net
772,000
194,000
Other Assets
197,000
69,400
Total Assets
$
1,239,000
$
357,400
Current Liabilities
$
170,000
$
20,000
Note Payable (long-term) (12% interest rate)
268,000
68,000
Common Stock (par $20)
673,000
253,000
Additional Paid-in Capital
71,000
5,800
Retained Earnings
57,000
10,600
Total Liabilities and Stockholders’ Equity
$
1,239,000
$
357,400
Income Statement
Sales Revenue
$
1,123,000
$
339,000
Cost...
Thor
Company
Gunnar
Company
Balance Sheet
Cash
$
36,000
$
33,000
Accounts Receivable, Net
78,000
29,000
Inventory
156,000
32,000
Equipment, Net
772,000
194,000
Other Assets
197,000
69,400
Total Assets
$
1,239,000
$
357,400
Current Liabilities
$
170,000
$
20,000
Note Payable (long-term) (12% interest rate)
268,000
68,000
Common Stock (par $20)
673,000
253,000
Additional Paid-in Capital
71,000
5,800
Retained Earnings
57,000
10,600
Total Liabilities and Stockholders’ Equity
$
1,239,000
$
357,400
Income Statement
Sales Revenue
$
1,123,000
$
339,000
Cost...
Most questions answered within 3 hours.
-
Where is the error in this code sequence?
String s1 = "Hello";
String s2 = "ello";...
asked 10 months ago -
Financial data for Joel de Paris, Inc., for last year
follow:
Joel de Paris, Inc.
Balance...
asked 10 months ago -
Consider this reaction:
Al2(SO4)3 (aq)+ BaCl3
(aq) Al2Cl6 (aq)- +
3BaSO4(s) . What is the...
asked 10 months ago -
Suppose that Savneet is considering increasing her
recent random sample from 20 car rentals to 40...
asked 10 months ago -
Trucks arrive at an unloading terminal at an average rate of 120
per hour.
Trucks arrive...
asked 10 months ago -
Why are methanol and ethanol completely soluble in water while
octanol is not very little soluble....
asked 10 months ago -
A facilities manager at a university reads in a research report
that the mean amount of...
asked 10 months ago -
When the CuSO4 is rehydrated by adding water to the anhydrous
compound, is this an endothermic...
asked 10 months ago -
A ray of sunlight is passing from diamond into crown glass; the
angle of incidence is...
asked 10 months ago -
A block of mass 0.249 kg is placed on top of a light, vertical
spring of...
asked 10 months ago -
how do the kidneys compensate in the presences of acidosis
a) trigger hyperventilate
b) reserve acid...
asked 10 months ago -
Question 501 pts
The rental rate of capital to the firm increases. Which of the
following...
asked 10 months ago