
Here is the information that is needed for this work:
1 2 5 5 20 1 R2-29522 5 2 4 3 5 8 1 0 9 2 3 4 5 3 5 3 9 4 5 2 8 4 4 3 8 6 3 3 5 9 3 4 6 0 5 0 4 1027251 1 1 2 112 14456694518974191469644566466957464465944956794ー4 1 1 5 5 52 8 1 2 5 17 4 7 1 4 1 4 5 5 0 9 7 8 0 4 7 5 5 0 0 6 6 3 0 4 3 7 5 6 9 6 8 5 8 3 7 6 4 5 7 5 0 1573653634 2122 32122212221221 2112211112
Homework Answers
regression summary , coefficient table and F-test
| SUMMARY OUTPUT | |||||
| Regression Statistics | |||||
| Multiple R | 0.585123024 | ||||
| R Square | 0.342368953 | ||||
| Adjusted R Square | 0.299479971 | ||||
| Standard Error | 5.412552887 | ||||
| Observations | 50 | ||||
| ANOVA | |||||
| df | SS | MS | F | Significance F | |
| Regression | 3 | 701.5751592 | 233.8583864 | 7.982678579 | 0.00021757 |
| Residual | 46 | 1347.603523 | 29.29572876 | ||
| Total | 49 | 2049.178682 | |||
| Coefficients | Standard Error | t Stat | P-value | Lower 95% | |
| Intercept | 7.872986591 | 4.087193427 | 1.926257401 | 0.06026464 | -0.354107071 |
| EDUC | 1.437060506 | 0.338639743 | 4.243626263 | 0.000105402 | 0.755414058 |
| EXPER | 0.448282229 | 0.141867317 | 3.159869648 | 0.002789784 | 0.162718131 |
| AGE | -0.011386246 | 0.083422321 | -0.1364892 | 0.89203017 | -0.179306669 |
wage^ = 7.873 + 1.4371 Educ + 0.4483 Exper -0.0114 Age
yes, all signs are as expected
wage is positively correlated with Education and experience
and is negatively correlated with age
coefficient of Education is 1.4371
as education increases by 1 unit, on average wage will increase by
1.45 units
coefficient of detemrination = 0.3427
hence 34.27% of variation in wage is explained by this model
Add Answer to:
Here is the information that is needed for this work: A researcher interviews 50 employees of a large manufacturer and colects data on each worker's hourly wage (Wage), years of higher education...
A researcher interviews 50 employees of a large manufacturer and collects data on each worker’s h...
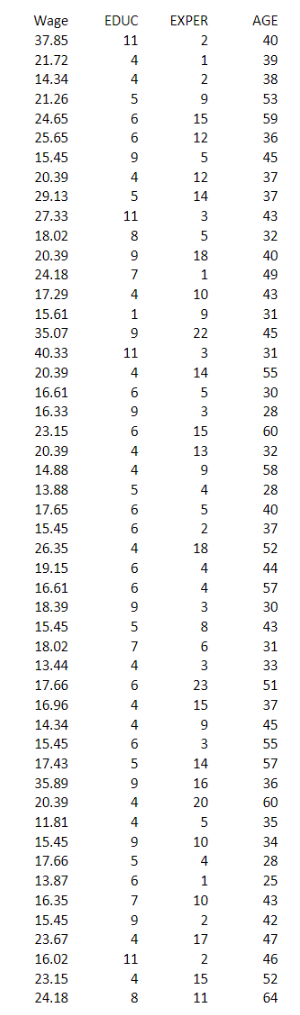
 A researcher interviews 50 employees of a large manufacturer and
collects data on each worker’s hourly wage (Wage), years of higher
education (EDUC), experience (EXPER), and age (AGE).
Wage
EDUC
EXPER
AGE
Male
37.85
11
2
40
1
21.72
4
1
39
0
⋮
⋮
⋮
⋮
⋮
24.18
8
11
64
0
A researcher interviews 50 employees of a large manufacturer and collects data on each worker's hourly wage (Wage), years of higher education (EDUC), experience (EXPER), and age...
A researcher interviews 50 employees of a large manufacturer and
collects data on each worker’s hourly wage (Wage), years of higher
education (EDUC), experience (EXPER), and age (AGE).
Wage
EDUC
EXPER
AGE
Male
37.85
11
2
40
1
21.72
4
1
39
0
⋮
⋮
⋮
⋮
⋮
24.18
8
11
64
0
A researcher interviews 50 employees of a large manufacturer and collects data on each worker's hourly wage (Wage), years of higher education (EDUC), experience (EXPER), and age...
Using data from 50 workers, a researcher estimates Wage = β0 + β1Education + β2Experience +...
Using data from 50 workers, a researcher estimates Wage = β0 + β1Education + β2Experience + β3Age + ε, where Wage is the hourly wage rate and Education, Experience, and Age are the years of higher education, the years of experience, and the age of the worker, respectively. The regression results are shown in the following table. Coefficients Standard Error t Stat p-Value Intercept 7.17 4.26 1.68 0.0991 Education 1.81 0.35 5.17 0.0000 Experience 0.45 0.10 4.50 0.0000 Age −0.01...
Using data from 50 workers, a researcher estimates Wage = β0 + β1Education + β2Experience +...
Using data from 50 workers, a researcher estimates Wage = β0 + β1Education + β2Experience + β3Age + ε, where Wage is the hourly wage rate and Education, Experience, and Age are the years of higher education, the years of experience, and the age of the worker, respectively. The regression results are shown in the following table. Coefficients Standard Error t Stat p-Value Intercept 7.73 3.94 1.96 0.0558 Education 1.15 0.39 2.95 0.0050 Experience 0.45 0.11 4.09 0.0002 Age −0.03...
Using data from 50 workers, a researcher estimates Wage = β0 + β1Education + β2Experience +...
Using data from 50 workers, a researcher estimates Wage = β0 + β1Education + β2Experience + β3Age + ε, where Wage is the hourly wage rate and Education, Experience, and Age are the years of higher education, the years of experience, and the age of the worker, respectively. The regression results are shown in the following table. Coefficients Standard Error t Stat p-Value Intercept 8.23 4.40 1.87 0.0678 Education 1.23 0.38 3.24 0.0022 Experience 0.53 0.18 2.94 0.0051 Age −0.08...
2 Using data from 50 workers, a researcher estimates Wage BoIEducation + 2Experience B3Age E, where...
 2 Using data from 50 workers, a researcher estimates Wage BoIEducation + 2Experience B3Age E, where Wage is the hourly wage rate and Education, Experience, and Age are the years of higher education, the years of experience, and the age of the worker respectively. The regression results are shown in the following table. 10 points Standard Coefficients t Stat P-Value 0.1310 0.0003 0.0022 Error 4.24 Intercept Education Experience Age 6.52 1.32 1.54 0.34 0.12 3.88 3.25 -0.20 0.39 0.01 0.05...
Using data from 50 workers, a researcher estimates Wage = ?0 + ?1Education + ?2Experience +...
Using data from 50 workers, a researcher estimates Wage = ?0 + ?1Education + ?2Experience + ?3Age + ?, where Wage is the hourly wage rate and Education, Experience, and Age are the years of higher education, the years of experience, and the age of the worker, respectively. The regression results are shown in the following table. Coefficients Standard Error t Stat p-Value Intercept 7.58 4.42 1.71 0.0931 Education 1.68 0.37 4.54 0.0000 Experience 0.35 0.18 1.94 0.0580 Age ?0.06...
>|10|1|00001100-10110100 )13-175576 3 3 5 3 4 5 53 548532762 332244445 35931-12 10-4-0 5 2 2 1 7 ...
 please answer this question subject about Business Statistics
thanks
>|10|1|00001100-10110100 )13-175576 3 3 5 3 4 5 53 548532762 332244445 35931-12 10-4-0 5 2 2 1 7 4 6 4 4 6 5 9 4 4 9 5 6 794 453991567557258 04693|44838468346011 |00 | 3 7 6 4 5 7 5 0 1 5 7 3 6 5 3 6 34 a 1001110011011000-1 10-01-0101| 0 0 10 2880724703 3524354534 09| 8 3 9 6 5 7 7 3 2093151508 43355343343444343532...
please answer this question subject about Business Statistics
thanks
>|10|1|00001100-10110100 )13-175576 3 3 5 3 4 5 53 548532762 332244445 35931-12 10-4-0 5 2 2 1 7 4 6 4 4 6 5 9 4 4 9 5 6 794 453991567557258 04693|44838468346011 |00 | 3 7 6 4 5 7 5 0 1 5 7 3 6 5 3 6 34 a 1001110011011000-1 10-01-0101| 0 0 10 2880724703 3524354534 09| 8 3 9 6 5 7 7 3 2093151508 43355343343444343532...
2. The following data were collected last semester on ten students. Complete a multiple regression analysis in which you use AGE (A), MATH PROFICIENCY (MP) (on a 1 –10 scale), and GENDER (G) (0 = male...
2. The following data were collected last semester on ten students. Complete a multiple regression analysis in which you use AGE (A), MATH PROFICIENCY (MP) (on a 1 –10 scale), and GENDER (G) (0 = male, 1 = female) as predictors of FINAL EXAM (FE) performance. Do this analysis in SPSS and then answer the following questions. Subject # A MP G FE 1 35 8 1 90 2 31 6 0 88 3 26 5 1 84 4 33...
1. Use Minitab to get the same type of output (including graphs) with the following Income/Education data as the li...
 1. Use Minitab to get the same type of output (including graphs) with the following Income/Education data as the little data set discussed in class. Do the regression of Income on Education. Interpret the meaning of the coefficient of Education. What do you predict income to be for a person with 17 years of education? Why do you think Income for 21 years of Education is lower than Income for 19 years of Education in the data set? Education in...
20. A social scientist would like to analyze the relationship between educational attainment (in years of higher education) and annual salary (in $1,000s). He collects data on 20 individuals. A portio...
20. A social scientist would like to analyze the relationship between educational attainment (in years of higher education) and annual salary (in $1,000s). He collects data on 20 individuals. A portion of the data is as follows: Salary Education 35 1 67 6 ⋮ ⋮ 32 0 a. Find the sample regression equation for the model: Salary = β0 + β1Education + ε. (Round answers to 2 decimal places.) Salaryˆ=Salary^= + Education b. Interpret the coefficient for Education. As Education...
 A researcher interviews 50 employees of a large manufacturer and
collects data on each worker’s hourly wage (Wage), years of higher
education (EDUC), experience (EXPER), and age (AGE).
Wage
EDUC
EXPER
AGE
Male
37.85
11
2
40
1
21.72
4
1
39
0
⋮
⋮
⋮
⋮
⋮
24.18
8
11
64
0
A researcher interviews 50 employees of a large manufacturer and collects data on each worker's hourly wage (Wage), years of higher education (EDUC), experience (EXPER), and age...
A researcher interviews 50 employees of a large manufacturer and
collects data on each worker’s hourly wage (Wage), years of higher
education (EDUC), experience (EXPER), and age (AGE).
Wage
EDUC
EXPER
AGE
Male
37.85
11
2
40
1
21.72
4
1
39
0
⋮
⋮
⋮
⋮
⋮
24.18
8
11
64
0
A researcher interviews 50 employees of a large manufacturer and collects data on each worker's hourly wage (Wage), years of higher education (EDUC), experience (EXPER), and age...
 2 Using data from 50 workers, a researcher estimates Wage BoIEducation + 2Experience B3Age E, where Wage is the hourly wage rate and Education, Experience, and Age are the years of higher education, the years of experience, and the age of the worker respectively. The regression results are shown in the following table. 10 points Standard Coefficients t Stat P-Value 0.1310 0.0003 0.0022 Error 4.24 Intercept Education Experience Age 6.52 1.32 1.54 0.34 0.12 3.88 3.25 -0.20 0.39 0.01 0.05...
 please answer this question subject about Business Statistics
thanks
>|10|1|00001100-10110100 )13-175576 3 3 5 3 4 5 53 548532762 332244445 35931-12 10-4-0 5 2 2 1 7 4 6 4 4 6 5 9 4 4 9 5 6 794 453991567557258 04693|44838468346011 |00 | 3 7 6 4 5 7 5 0 1 5 7 3 6 5 3 6 34 a 1001110011011000-1 10-01-0101| 0 0 10 2880724703 3524354534 09| 8 3 9 6 5 7 7 3 2093151508 43355343343444343532...
please answer this question subject about Business Statistics
thanks
>|10|1|00001100-10110100 )13-175576 3 3 5 3 4 5 53 548532762 332244445 35931-12 10-4-0 5 2 2 1 7 4 6 4 4 6 5 9 4 4 9 5 6 794 453991567557258 04693|44838468346011 |00 | 3 7 6 4 5 7 5 0 1 5 7 3 6 5 3 6 34 a 1001110011011000-1 10-01-0101| 0 0 10 2880724703 3524354534 09| 8 3 9 6 5 7 7 3 2093151508 43355343343444343532...
 1. Use Minitab to get the same type of output (including graphs) with the following Income/Education data as the little data set discussed in class. Do the regression of Income on Education. Interpret the meaning of the coefficient of Education. What do you predict income to be for a person with 17 years of education? Why do you think Income for 21 years of Education is lower than Income for 19 years of Education in the data set? Education in...
Most questions answered within 3 hours.
-
Where is the error in this code sequence?
String s1 = "Hello";
String s2 = "ello";...
asked 10 months ago -
Financial data for Joel de Paris, Inc., for last year
follow:
Joel de Paris, Inc.
Balance...
asked 10 months ago -
Consider this reaction:
Al2(SO4)3 (aq)+ BaCl3
(aq) Al2Cl6 (aq)- +
3BaSO4(s) . What is the...
asked 10 months ago -
Suppose that Savneet is considering increasing her
recent random sample from 20 car rentals to 40...
asked 10 months ago -
Trucks arrive at an unloading terminal at an average rate of 120
per hour.
Trucks arrive...
asked 10 months ago -
Why are methanol and ethanol completely soluble in water while
octanol is not very little soluble....
asked 10 months ago -
A facilities manager at a university reads in a research report
that the mean amount of...
asked 10 months ago -
When the CuSO4 is rehydrated by adding water to the anhydrous
compound, is this an endothermic...
asked 10 months ago -
A ray of sunlight is passing from diamond into crown glass; the
angle of incidence is...
asked 10 months ago -
A block of mass 0.249 kg is placed on top of a light, vertical
spring of...
asked 10 months ago -
how do the kidneys compensate in the presences of acidosis
a) trigger hyperventilate
b) reserve acid...
asked 10 months ago -
Question 501 pts
The rental rate of capital to the firm increases. Which of the
following...
asked 10 months ago