Suppose the following data were collected relating the selling price of a house to square footage and whether or not the house is made out of brick. Use statistical software to find the regression equation. Is there enough evidence to support the claim that on average brick houses are more expensive than other types of houses at the 0.05 level of significance? If yes, type the regression equation in the spaces provided with answers rounded to two decimal places. Else, select "There is not enough evidence."
I could not get the entire table in 1 picture so I took 2 pictures
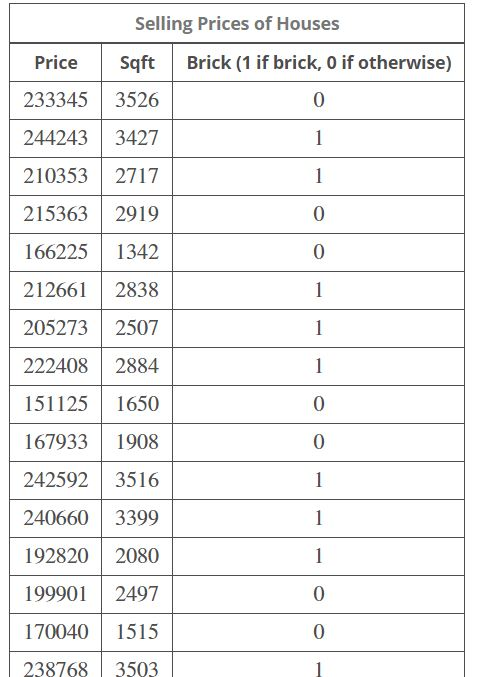

These are the numbers from the 2nd picture in case they are too small
| 226069 | 3263 | 0 |
| 186387 | 2258 | 0 |
| 204800 | 2495 | 1 |
| 214960 | 2772 | 0 |
226069 3263 186387 2258 204800 2495 214960 2772 0 0 0 EEB Tables Answer How to enter your answer Selecting a checkbox will replace the entered answer value(s) with the checkbox value. If the checkbox is not selected, the entered answer is used PRICE SQFT+ BRICK e There is not enough evidence
Homework Answers
Solution:
Here, we have to develop a regression model for the prediction of the dependent variable price based on the independent variables sqft and Brick. The required regression model by using excel is given as below:
|
Regression Statistics |
||||||
|
Multiple R |
0.977198575 |
|||||
|
R Square |
0.954917055 |
|||||
|
Adjusted R Square |
0.949613179 |
|||||
|
Standard Error |
6228.160973 |
|||||
|
Observations |
20 |
|||||
|
ANOVA |
||||||
|
df |
SS |
MS |
F |
Significance F |
||
|
Regression |
2 |
13967605236 |
6983802618 |
180.0413658 |
3.6233E-12 |
|
|
Residual |
17 |
659429814.7 |
38789989.1 |
|||
|
Total |
19 |
14627035050 |
||||
|
Coefficients |
Standard Error |
t Stat |
P-value |
Lower 95% |
Upper 95% |
|
|
Intercept |
106558.0743 |
5751.587409 |
18.52672432 |
1.0411E-12 |
94423.28574 |
118692.8629 |
|
Sqft |
36.60749499 |
2.28493242 |
16.02125939 |
1.08392E-11 |
31.78670902 |
41.42828096 |
|
Brick |
7398.155862 |
3076.330574 |
2.404863744 |
0.027851055 |
907.6657545 |
13888.64597 |
The p-value for this regression model is given as 3.6233E-12 ≈ 0.00 which is less than alpha value 0.05, so we reject the null hypothesis. There is sufficient evidence to conclude that the given regression model is statistically significant for the prediction of the dependent variable price.
The required regression equation is given as below:
PRICEi = 106558.07 + 36.61*SQFTi + 7398.16*BRICKi + ei
Add Answer to:
Suppose the following data were collected relating the selling price of a house to square footage and whether or not the house is made out of brick. Use statistical software to find the regression equ...
Suppose the following data were collected relating the selling price of a house to square footage...
 Suppose the following data were collected relating the selling
price of a house to square footage and whether or not the house is
made out of wood. Use statistical software to find the regression
equation. Is there enough evidence to support the claim that on
average wood houses are more expensive than other types of houses
at the 0.01 level of significance? If yes, type the regression
equation in the spaces provided with answers rounded to two decimal
places. Else,...
Suppose the following data were collected relating the selling
price of a house to square footage and whether or not the house is
made out of wood. Use statistical software to find the regression
equation. Is there enough evidence to support the claim that on
average wood houses are more expensive than other types of houses
at the 0.01 level of significance? If yes, type the regression
equation in the spaces provided with answers rounded to two decimal
places. Else,...
Suppose the following data were collected from a sample of 15 CEOs relating annual salary to...
 Suppose the following data were collected from a sample of 15
CEOs relating annual salary to years of experience and the economic
sector their company belongs to. Use statistical software to find
the following regression equation:
SALARYi=b0+b1EXPERIENCEi+b2SERVICEi+b3INDUSTRIALi+ei .
Is there enough evidence to support the claim that on average,
CEOs in the industrial sector have lower salaries than CEOs in the
financial sector at the 0.05 level of significance?
If yes, write the regression equation in the spaces provided
with...
Suppose the following data were collected from a sample of 15
CEOs relating annual salary to years of experience and the economic
sector their company belongs to. Use statistical software to find
the following regression equation:
SALARYi=b0+b1EXPERIENCEi+b2SERVICEi+b3INDUSTRIALi+ei .
Is there enough evidence to support the claim that on average,
CEOs in the industrial sector have lower salaries than CEOs in the
financial sector at the 0.05 level of significance?
If yes, write the regression equation in the spaces provided
with...
1/11 Question 2 of 10, Step 1 of 1 Correct Suppose the following data were collected...
 1/11 Question 2 of 10, Step 1 of 1 Correct Suppose the following data were collected from a sample of 5 car manufacturers relating monthly car sales to the number of dealerships and the quarter of the year. Use statistical software to find the following regression equation bo+b DEALERSHIPS, + bQUARTERI, + byQUARTER2, +b,QUARTER3, + e SALES, Is there enough evidence to support the claim that on average, car sales are higher in the 4th quarter than in the 1st...
 Suppose the following data were collected relating the selling
price of a house to square footage and whether or not the house is
made out of wood. Use statistical software to find the regression
equation. Is there enough evidence to support the claim that on
average wood houses are more expensive than other types of houses
at the 0.01 level of significance? If yes, type the regression
equation in the spaces provided with answers rounded to two decimal
places. Else,...
Suppose the following data were collected relating the selling
price of a house to square footage and whether or not the house is
made out of wood. Use statistical software to find the regression
equation. Is there enough evidence to support the claim that on
average wood houses are more expensive than other types of houses
at the 0.01 level of significance? If yes, type the regression
equation in the spaces provided with answers rounded to two decimal
places. Else,...
 Suppose the following data were collected from a sample of 15
CEOs relating annual salary to years of experience and the economic
sector their company belongs to. Use statistical software to find
the following regression equation:
SALARYi=b0+b1EXPERIENCEi+b2SERVICEi+b3INDUSTRIALi+ei .
Is there enough evidence to support the claim that on average,
CEOs in the industrial sector have lower salaries than CEOs in the
financial sector at the 0.05 level of significance?
If yes, write the regression equation in the spaces provided
with...
Suppose the following data were collected from a sample of 15
CEOs relating annual salary to years of experience and the economic
sector their company belongs to. Use statistical software to find
the following regression equation:
SALARYi=b0+b1EXPERIENCEi+b2SERVICEi+b3INDUSTRIALi+ei .
Is there enough evidence to support the claim that on average,
CEOs in the industrial sector have lower salaries than CEOs in the
financial sector at the 0.05 level of significance?
If yes, write the regression equation in the spaces provided
with...
 1/11 Question 2 of 10, Step 1 of 1 Correct Suppose the following data were collected from a sample of 5 car manufacturers relating monthly car sales to the number of dealerships and the quarter of the year. Use statistical software to find the following regression equation bo+b DEALERSHIPS, + bQUARTERI, + byQUARTER2, +b,QUARTER3, + e SALES, Is there enough evidence to support the claim that on average, car sales are higher in the 4th quarter than in the 1st...
Most questions answered within 3 hours.
-
Where is the error in this code sequence?
String s1 = "Hello";
String s2 = "ello";...
asked 11 months ago -
Financial data for Joel de Paris, Inc., for last year
follow:
Joel de Paris, Inc.
Balance...
asked 11 months ago -
Consider this reaction:
Al2(SO4)3 (aq)+ BaCl3
(aq) Al2Cl6 (aq)- +
3BaSO4(s) . What is the...
asked 11 months ago -
Suppose that Savneet is considering increasing her
recent random sample from 20 car rentals to 40...
asked 11 months ago -
Trucks arrive at an unloading terminal at an average rate of 120
per hour.
Trucks arrive...
asked 11 months ago -
Why are methanol and ethanol completely soluble in water while
octanol is not very little soluble....
asked 11 months ago -
A facilities manager at a university reads in a research report
that the mean amount of...
asked 11 months ago -
When the CuSO4 is rehydrated by adding water to the anhydrous
compound, is this an endothermic...
asked 11 months ago -
A ray of sunlight is passing from diamond into crown glass; the
angle of incidence is...
asked 11 months ago -
A block of mass 0.249 kg is placed on top of a light, vertical
spring of...
asked 11 months ago -
how do the kidneys compensate in the presences of acidosis
a) trigger hyperventilate
b) reserve acid...
asked 11 months ago -
Question 501 pts
The rental rate of capital to the firm increases. Which of the
following...
asked 11 months ago