

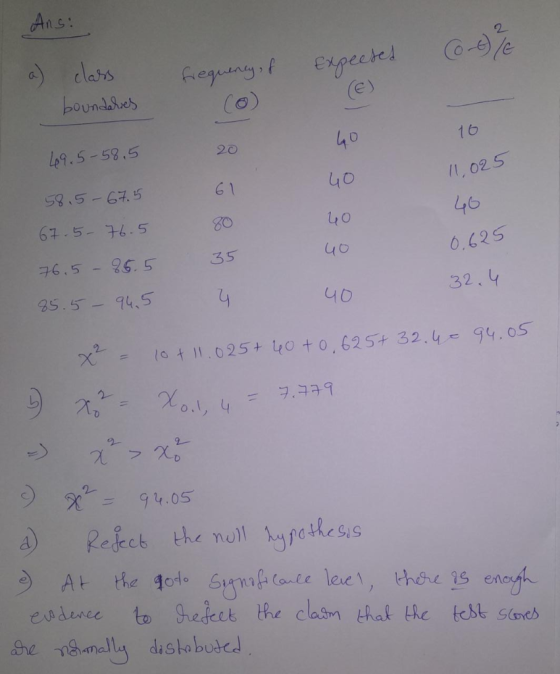
(b) Determine the critical value, χ, and the rejection region I l (Round to three decimal places as needed ) Choose the correct rejection region below (c) Calculate the test statistic. Round to three decimal places as needed.) (d) Decide whether to reject or fail to reject the null hypothesis e) Interpret the decisiorn in the contexd of the original claim At the 10% significance level, there ' enough evidence to elect the claim that the test scores are normally distributed.
Homework Answers
Add Answer to:
The frequency distribution shows the results of 200 test scores Are the test scores nomally distributed? Use α-0.10 Complete parts is) through (e) Class boundaries Frequency, 49.5-585 2D 58.5-67.5 51...
The frequency distribution shows the results of 200 test scores. Are the test scores normally distributed?...
 The frequency distribution shows the results of 200 test scores. Are the test scores normally distributed? Use a =0.01. Complete parts (a) through (e). Class boundaries 49.5-58.5 58.5-67.5 Frequency, f 19 62 D 67.5-76.5 81 76.5-85.5 33 85.5-94.5 5 Using a chi-square goodness-of-fit test, you can decide, with some degree of certainty, whether a variable is normally distributed. In all chi-square tests for normality, the null and alternative hypotheses are as follows. Ho: The test scores have a normal distribution....
The frequency distribution shows the results of 200 test scores. Are the test scores normally distributed?...
 The frequency distribution shows the results of 200 test scores.
Are the test scores normally distributed?
PART B. Determine the critical
value and the rejected region
PART C. Calculate the test statistic
PART D. Decide whether to reject or fail to reject the
null hypothesis
The frequency distribution shows the results of 200 test scores. Are the test scores normally distributed? Use α= 0.01. Complete parts (a) through (d) Class boundaries Frequency, f 49.5-58.5 20 58.5-67.5 62 67.5-76.5 79 76.5-85.5...
The frequency distribution shows the results of 200 test scores.
Are the test scores normally distributed?
PART B. Determine the critical
value and the rejected region
PART C. Calculate the test statistic
PART D. Decide whether to reject or fail to reject the
null hypothesis
The frequency distribution shows the results of 200 test scores. Are the test scores normally distributed? Use α= 0.01. Complete parts (a) through (d) Class boundaries Frequency, f 49.5-58.5 20 58.5-67.5 62 67.5-76.5 79 76.5-85.5...
The frequency distribution shows the results of 200 test scores. Are the test scores normally distributed?...
The frequency distribution shows the results of 200 test scores. Are the test scores normally distributed? Use α=0.01. Class boundaries 49.5-58.5 58.5-67.5 67.5-76.5 76.5-85.5 85.5-94.5 Frequency, f 202 61 79 35 5 Using a chi-square goodness-of-fit test, you can decide, with some degree of certainty, whether a variable is normally distributed. In all chi-square tests for normality, the null and alternative hypotheses are as follows. H0: The test scores have a normal distribution. Ha: The test scores do not have...
 The frequency distribution shows the results of 200 test scores. Are the test scores normally distributed? Use a =0.01. Complete parts (a) through (e). Class boundaries 49.5-58.5 58.5-67.5 Frequency, f 19 62 D 67.5-76.5 81 76.5-85.5 33 85.5-94.5 5 Using a chi-square goodness-of-fit test, you can decide, with some degree of certainty, whether a variable is normally distributed. In all chi-square tests for normality, the null and alternative hypotheses are as follows. Ho: The test scores have a normal distribution....
 The frequency distribution shows the results of 200 test scores.
Are the test scores normally distributed?
PART B. Determine the critical
value and the rejected region
PART C. Calculate the test statistic
PART D. Decide whether to reject or fail to reject the
null hypothesis
The frequency distribution shows the results of 200 test scores. Are the test scores normally distributed? Use α= 0.01. Complete parts (a) through (d) Class boundaries Frequency, f 49.5-58.5 20 58.5-67.5 62 67.5-76.5 79 76.5-85.5...
The frequency distribution shows the results of 200 test scores.
Are the test scores normally distributed?
PART B. Determine the critical
value and the rejected region
PART C. Calculate the test statistic
PART D. Decide whether to reject or fail to reject the
null hypothesis
The frequency distribution shows the results of 200 test scores. Are the test scores normally distributed? Use α= 0.01. Complete parts (a) through (d) Class boundaries Frequency, f 49.5-58.5 20 58.5-67.5 62 67.5-76.5 79 76.5-85.5...
Most questions answered within 3 hours.
-
Where is the error in this code sequence?
String s1 = "Hello";
String s2 = "ello";...
asked 10 months ago -
Financial data for Joel de Paris, Inc., for last year
follow:
Joel de Paris, Inc.
Balance...
asked 10 months ago -
Consider this reaction:
Al2(SO4)3 (aq)+ BaCl3
(aq) Al2Cl6 (aq)- +
3BaSO4(s) . What is the...
asked 10 months ago -
Suppose that Savneet is considering increasing her
recent random sample from 20 car rentals to 40...
asked 10 months ago -
Trucks arrive at an unloading terminal at an average rate of 120
per hour.
Trucks arrive...
asked 10 months ago -
Why are methanol and ethanol completely soluble in water while
octanol is not very little soluble....
asked 10 months ago -
A facilities manager at a university reads in a research report
that the mean amount of...
asked 10 months ago -
When the CuSO4 is rehydrated by adding water to the anhydrous
compound, is this an endothermic...
asked 10 months ago -
A ray of sunlight is passing from diamond into crown glass; the
angle of incidence is...
asked 10 months ago -
A block of mass 0.249 kg is placed on top of a light, vertical
spring of...
asked 10 months ago -
how do the kidneys compensate in the presences of acidosis
a) trigger hyperventilate
b) reserve acid...
asked 10 months ago -
Question 501 pts
The rental rate of capital to the firm increases. Which of the
following...
asked 10 months ago