
Homework Answers
a)
b)
H0: µ1=µ2=-----=µn
H1: At least one pair of samples is significantly different
p-value<0.00001 (the result is significant)
Add Answer to:
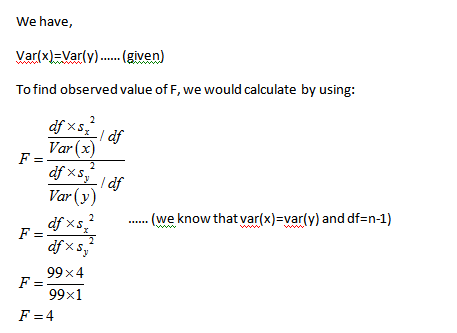
Question 2. Suppose (X.,X) . FXY, for i = 1, , n. We collect sample data for n-100, obtain sz-2 and Sy-1, and would like to test H0 : Var(x)-Var(y) versus HA : Var(z) Var(y). (a) Using the F test, wh...
All that I need to explain how we get 0.44725 in Part (f) (i) Obtain the expected values of X and Y E(X)-0.29; E(Y)-0.2...
 All that I need to explain how we get 0.44725 in Part (f)
(i) Obtain the expected values of X and Y E(X)-0.29; E(Y)-0.27 (ii) Obtain the variances of X and Y 2.2 . 10-4 Var(X) Var(Y) - 9.874 105 (d) Write down the test statistic for testing Ho: p1 p2 versus Ha: p1 p2 Test St = 2 where the "pooled" standard deviation is n+ n 2 with ơf-Var(X) and σ Var(Y) and nı'n, adjusted accordingly. (e) What is...
All that I need to explain how we get 0.44725 in Part (f)
(i) Obtain the expected values of X and Y E(X)-0.29; E(Y)-0.27 (ii) Obtain the variances of X and Y 2.2 . 10-4 Var(X) Var(Y) - 9.874 105 (d) Write down the test statistic for testing Ho: p1 p2 versus Ha: p1 p2 Test St = 2 where the "pooled" standard deviation is n+ n 2 with ơf-Var(X) and σ Var(Y) and nı'n, adjusted accordingly. (e) What is...
Suppose for the two exams in this course, we would like to see if there is any significant improvement from exam 1 to exam 2, i.e., testing H0 : µx ≥ µy vs HA : µx < µy for the average exam scores....
Suppose for the two exams in this course, we would like to see if there is any significant improvement from exam 1 to exam 2, i.e., testing H0 : µx ≥ µy vs HA : µx < µy for the average exam scores. Suppose we have n = 36 students, and the sample statistics are x¯ = 21, y¯ = 22, sx = sy = 3 and sxy = 4.5. Compute the p-value using paired two-sample test Suppose we use...
#1 part A.) To test H0: μ=100 versus H1: μ≠100, a random sample of size n=20...
#1 part A.) To test H0: μ=100 versus H1: μ≠100, a random sample of size n=20 is obtained from a population that is known to be normally distributed. Complete parts (a) through (d) below. (aa.) If x̅=104.4 and s=9.4, compute the test statistic. t0 = __________ (bb.) If the researcher decides to test this hypothesis at the α=0.01 level of significance, determine the critical value(s). Although technology or a t-distribution table can be used to find the critical value, in...
Suppose that X1, X2, . . . , Xn is an iid sample of N (0, σ2 ) observations, where σ 2 > 0 is unknown. Consider testing H0 : σ 2 = σ 2 0 versus H1 : σ 2 6= σ 2 0
 Suppose that X1, X2, . . . , Xn is an iid sample of N (0, σ2
) observations, where σ
2 > 0 is
unknown. Consider testing
H0 : σ
2 = σ
2
0 versus H1 : σ
2
6= σ
2
0
;
where σ
2
0
is known.
(a) Derive a size α likelihood ratio test of H0 versus H1. Your rejection region should
be written in terms of a sufficient statistic.
(b) When the null...
Suppose that X1, X2, . . . , Xn is an iid sample of N (0, σ2
) observations, where σ
2 > 0 is
unknown. Consider testing
H0 : σ
2 = σ
2
0 versus H1 : σ
2
6= σ
2
0
;
where σ
2
0
is known.
(a) Derive a size α likelihood ratio test of H0 versus H1. Your rejection region should
be written in terms of a sufficient statistic.
(b) When the null...
3. Let X,,X,,..., X, be a random sample from a Gamma 40distribution, where 6>0. we wish to test H0 : θ-1 vs. Hi : θ #1. Show that the likelihood ratio test statistic, A , can be written as A(V) wh...
 3. Let X,,X,,..., X, be a random sample from a Gamma 40distribution, where 6>0. we wish to test H0 : θ-1 vs. Hi : θ #1. Show that the likelihood ratio test statistic, A , can be written as A(V) where a. What is the distribution of V? what is the null distribution of what will be the rejection region for an α level test? b. 20 d.
3. Let X,,X,,..., X, be a random sample from a Gamma 40distribution,...
3. Let X,,X,,..., X, be a random sample from a Gamma 40distribution, where 6>0. we wish to test H0 : θ-1 vs. Hi : θ #1. Show that the likelihood ratio test statistic, A , can be written as A(V) where a. What is the distribution of V? what is the null distribution of what will be the rejection region for an α level test? b. 20 d.
3. Let X,,X,,..., X, be a random sample from a Gamma 40distribution,...
Suppose we would like to test H_0: μ x = μ y . Denote the unpaired...
Suppose we would like to test H_0: μ x = μ y . Denote the unpaired two-sample normalized test statistic as t 1 , and the ANOVA F test statistic as \\ t 2 . Suppose for given sample data of equal sample size, we get t 1 = 10 . Compute t 2 . Hint: For equal sample size, establish a relationship between unpaired two-sample test and ANOVA F test.
Consider the following hypothesis test. H0: 1 - 2 ≤ 0 Ha: 1 - 2 >...
Consider the following hypothesis test. H0: 1 - 2 ≤ 0 Ha: 1 - 2 > 0 The following results are for two independent samples taken from the two populations. Sample 1 Sample 2 n 1 = 30 n 2 = 70 x 1 = 25.5 x 2 = 22.1 σ 1 = 5.3 σ 2 = 6 a. What is the value of the test statistic (round to 2 decimals)? b. What is the p-value (round to 4 decimals)?...
eBook Video Consider the following hypothesis test. H0: 1 - 2 ≤ 0 Ha: 1 -...
eBook Video Consider the following hypothesis test. H0: 1 - 2 ≤ 0 Ha: 1 - 2 > 0 The following results are for two independent samples taken from the two populations. Sample 1 Sample 2 n 1 = 40 n 2 = 50 x 1 = 25.5 x 2 = 22.3 σ 1 = 5.6 σ 2 = 6 a. What is the value of the test statistic (round to 2 decimals)? b. What is the p-value (round to...
Consider the following hypothesis test. H0:mean 1 -mean 2 ≤ 0 Ha: mean1 -mean 2 >...
Consider the following hypothesis test. H0:mean 1 -mean 2 ≤ 0 Ha: mean1 -mean 2 > 0 The following results are for two independent samples taken from the two populations. Sample 1 and sample 2: n 1 = 40 n 2 = 60 x 1 = 25.7 x 2 = 22.6 σ 1 = 5.6 σ 2 = 6 a. What is the value of the test statistic (round to 2 decimals)? b. What is the p-value (round to 4...
e. Consider the multiple regression model y X 3+E. with E(e)-0 and var (e) ơ21 Assume that ε ~ N(0 σ21), when we test the hypothesis Ho : βί-0 against Ha : βί 0 we use the t statistic with n-k-1 degr...
 e. Consider the multiple regression model y X 3+E. with E(e)-0 and var (e) ơ21 Assume that ε ~ N(0 σ21), when we test the hypothesis Ho : βί-0 against Ha : βί 0 we use the t statistic with n-k-1 degrees of freedom. When Ho is not true find the expected value and variance of the test onsider the genera -~ 0 gains 0 1S not true find the expected value and variance of the test statistic.
e. Consider...
e. Consider the multiple regression model y X 3+E. with E(e)-0 and var (e) ơ21 Assume that ε ~ N(0 σ21), when we test the hypothesis Ho : βί-0 against Ha : βί 0 we use the t statistic with n-k-1 degrees of freedom. When Ho is not true find the expected value and variance of the test onsider the genera -~ 0 gains 0 1S not true find the expected value and variance of the test statistic.
e. Consider...
 All that I need to explain how we get 0.44725 in Part (f)
(i) Obtain the expected values of X and Y E(X)-0.29; E(Y)-0.27 (ii) Obtain the variances of X and Y 2.2 . 10-4 Var(X) Var(Y) - 9.874 105 (d) Write down the test statistic for testing Ho: p1 p2 versus Ha: p1 p2 Test St = 2 where the "pooled" standard deviation is n+ n 2 with ơf-Var(X) and σ Var(Y) and nı'n, adjusted accordingly. (e) What is...
All that I need to explain how we get 0.44725 in Part (f)
(i) Obtain the expected values of X and Y E(X)-0.29; E(Y)-0.27 (ii) Obtain the variances of X and Y 2.2 . 10-4 Var(X) Var(Y) - 9.874 105 (d) Write down the test statistic for testing Ho: p1 p2 versus Ha: p1 p2 Test St = 2 where the "pooled" standard deviation is n+ n 2 with ơf-Var(X) and σ Var(Y) and nı'n, adjusted accordingly. (e) What is...
 3. Let X,,X,,..., X, be a random sample from a Gamma 40distribution, where 6>0. we wish to test H0 : θ-1 vs. Hi : θ #1. Show that the likelihood ratio test statistic, A , can be written as A(V) where a. What is the distribution of V? what is the null distribution of what will be the rejection region for an α level test? b. 20 d.
3. Let X,,X,,..., X, be a random sample from a Gamma 40distribution,...
3. Let X,,X,,..., X, be a random sample from a Gamma 40distribution, where 6>0. we wish to test H0 : θ-1 vs. Hi : θ #1. Show that the likelihood ratio test statistic, A , can be written as A(V) where a. What is the distribution of V? what is the null distribution of what will be the rejection region for an α level test? b. 20 d.
3. Let X,,X,,..., X, be a random sample from a Gamma 40distribution,...
 e. Consider the multiple regression model y X 3+E. with E(e)-0 and var (e) ơ21 Assume that ε ~ N(0 σ21), when we test the hypothesis Ho : βί-0 against Ha : βί 0 we use the t statistic with n-k-1 degrees of freedom. When Ho is not true find the expected value and variance of the test onsider the genera -~ 0 gains 0 1S not true find the expected value and variance of the test statistic.
e. Consider...
e. Consider the multiple regression model y X 3+E. with E(e)-0 and var (e) ơ21 Assume that ε ~ N(0 σ21), when we test the hypothesis Ho : βί-0 against Ha : βί 0 we use the t statistic with n-k-1 degrees of freedom. When Ho is not true find the expected value and variance of the test onsider the genera -~ 0 gains 0 1S not true find the expected value and variance of the test statistic.
e. Consider...
Most questions answered within 3 hours.
-
Where is the error in this code sequence?
String s1 = "Hello";
String s2 = "ello";...
asked 11 months ago -
Financial data for Joel de Paris, Inc., for last year
follow:
Joel de Paris, Inc.
Balance...
asked 11 months ago -
Consider this reaction:
Al2(SO4)3 (aq)+ BaCl3
(aq) Al2Cl6 (aq)- +
3BaSO4(s) . What is the...
asked 11 months ago -
Suppose that Savneet is considering increasing her
recent random sample from 20 car rentals to 40...
asked 11 months ago -
Trucks arrive at an unloading terminal at an average rate of 120
per hour.
Trucks arrive...
asked 11 months ago -
Why are methanol and ethanol completely soluble in water while
octanol is not very little soluble....
asked 11 months ago -
A facilities manager at a university reads in a research report
that the mean amount of...
asked 11 months ago -
When the CuSO4 is rehydrated by adding water to the anhydrous
compound, is this an endothermic...
asked 11 months ago -
A ray of sunlight is passing from diamond into crown glass; the
angle of incidence is...
asked 11 months ago -
A block of mass 0.249 kg is placed on top of a light, vertical
spring of...
asked 11 months ago -
how do the kidneys compensate in the presences of acidosis
a) trigger hyperventilate
b) reserve acid...
asked 11 months ago -
Question 501 pts
The rental rate of capital to the firm increases. Which of the
following...
asked 11 months ago