


Multiple Comparisons academic performance 2000 Dependent Variable: Tukey HSD (0 Percentage free meals in (J) Percertage free meals 0-46% free moals Mean Difference Std. Error S 166.324 301.338 166.324 8.708 135.014 8.612 301.338 8.629 135.014 8.708 47-80% free meals 81, 100% free meals 0-46% free meals 81-100% free meals 0-46% free meals 47-80% free meals 8.629 47-80% free meals 81-100% free meals 8.612 Multiple Comparisons Dependent Variable: academic performance 2000 Tukey HSD (1) Percentage free meals in 046% free meals 95% Confidence Interval (J) Percentage free meals 47-80% free meals 81-100% free meals 0-46% free meals 81-100% free meals 0-46% free meals 47-80% free meals Lower Bound 145.84 281.04 186.81 114.75 321.64 -155.27 Upper Bound 186.81 321.84 145.84 155.27 281.04 114.75 47-80% free meals 81-100% free meals The mean difference is significant at the 0.05 level. Homogeneous Subsets
academic performance 2000 Tukey HSDb Percentage tree meals in 3 0.05 Subset for alpha 137 504.38 132 131 81-100% free meals 47-80% free meals 0-46% free meals 639.39 805.72 1.000 1.000 1.000 Means for groups in homogeneous subsets are displayed. a. Uses Harmonic Mean Sample Size 133.282 b. The group sizes are unequal. The harmonic mean of the group sizes is used. Type I error levels are not guaranteed. T-TEST GROUPS yr rnd(0 1) /MISSING ANALYSIS /VARIABLES-api99 /CRITERICI(.95). T-Test
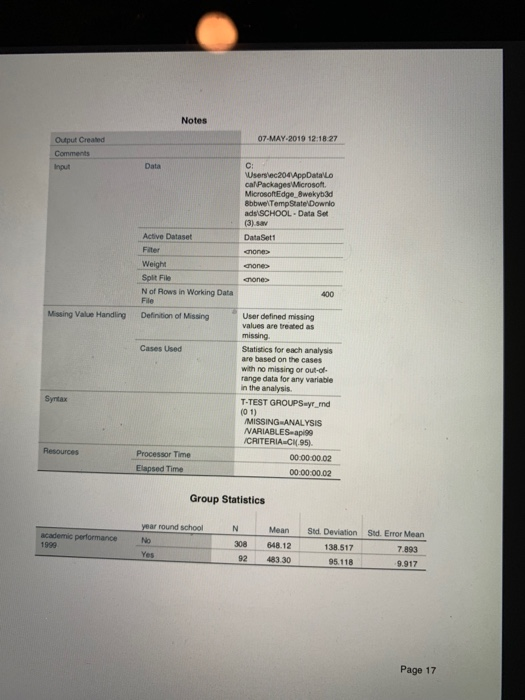
Notes 07-MAY-2019 12:1827 Output Created Data Input ca PackagesWicrosoft. MicrosoftEdge 8wekyb3d 8bbwelTempStatelDownlo ads SCHOOL Data Set (3)sav Active Dataset Weight Split File N of Rows in Working Data User defined missing values are treated as Definition of Missing Missing Value Handing Statistics for each analysis are based on the cases with no missing or out-of range data for any variable n the analysis Cases Used T-TEST GROUPS yr md Syntax (0 1) MISSING ANALYSIS WARIABLES api9e CRITERIA-C.95) Processor Time 0000:00.02 00:00:00.02 Group Statistics ar round school NMean 308 64812 92 483.30 Std. Deviation Std. Error Mean 7.893 9.917 138.517 95.118 1999 Page 17
Independent Samples Test Levene's Test for Equality of -test for Equality of Variances .000 10.681 31.389 31.389 academic performance 1999 Equal variances assumed 13.004 Equal variances not Independent Samples Test t-test for Equality of Means Mean df Sig.12-tailed) Dfference 398 164.816 Equal variances assumed 1999 164.816 Equal variances not 216.994 Independent Samples Test t-test for Equality of Means 95% Confidence Interval of the Std. Error Difference 15.431 Lower Upper Equal variances assumed 34.479 196.153 1999 Equal variances not 12.674 39.835 189.796 CORRELATIONS /VARIABLEs-api00 enroll /PRINT TWOTAIL NOSIG HISSING PAIRWISE Correlations
Notes 07-MAY-2019 12 19:58 Output Created Comments C: Data MicrosoftEdge 8wekyb3d 8bbweiTempState'Downlo ads SCHOOL Data Set (3).sav DataSett nones nones Active Dataset Filter Weight Split File N of Rows in Working Data File 400 User-defined missing values are treated as missing. Missing Value Handling Definition of Missing Statistics for each pair of variables are based on all the cases with valid data for that pair CORRELATIONS Cases Used WARIABLES api0o PRINT-TWOTAIL MISSING PAIRWISE enrol Processor Time Elapsed Time 00:00:00.00 00:0000.00 Correlations academic performance number of students Pearson Correlation 318 2000 9.02-tailed) . 400 number of students Pearson Correlation .318 Sg. (2- 400 ". Correlation is significant at the 0.01 level (2-tailed). Page 19
CROSSTABS /TABLES yr_rnd BY mealcat /FORMAT-AVALUE TABLES STATISTICS CHISo /CELLS COUNT ROW COLUMN /COUNT ROUND CELL. Crosstabs Notes 07-MAY-2019 12-22:03 Output Created Comments Data MicrosoftEdge_8wekyb3d 8bbwelTempState'Downlo ads SCHOOL-Data Set (3).sav Active Dataset DataSett Weight Split File N of Rows in Working Data Missing Value Handling Definition of Missing User-defined missing values are treated as Cases Used Statistics for each table are based on all the cases with valid data in the specfied range(s) for all variables in each table. Syntax CROSSTABS TABLESyr_nd BY FORMAT AVALUE TABLES STATISTICS-CHISO CELLS COUNT ROW COLUMN COUNT ROUND CELL Page 20
Notes 00:00:00.02 00.00:00.02 Processor Time Elapsed Time Dimensions Requested Ceils Available 524245 Case Processing Summary Cases Missing Total Percent N Percent N Percent 400 100.0% 0.0% 100.0% 400 year round school Percentage ftree meals in 3 year round school Percentage free meals in 3 categories Crosstabulation Percentage free meals in 3 categories 47-80% free meals 81-10096 free 0.46% free meals 67 124 year round school No Count 21.8% 403% 38.0% % within year round school % within Percentage free meals in 3 categories 94.7% 88.6% 48.9% Yes Count 15 70 78.1% % within year round school 76% 16.3% % within Percentage free 11.4% 5.3% 51.1% Total 132 33.0% 100.0% 137 131 % within year round school 34.3% 32.8% % within Percentage free meals in 3 categories 100.0% 100.0%
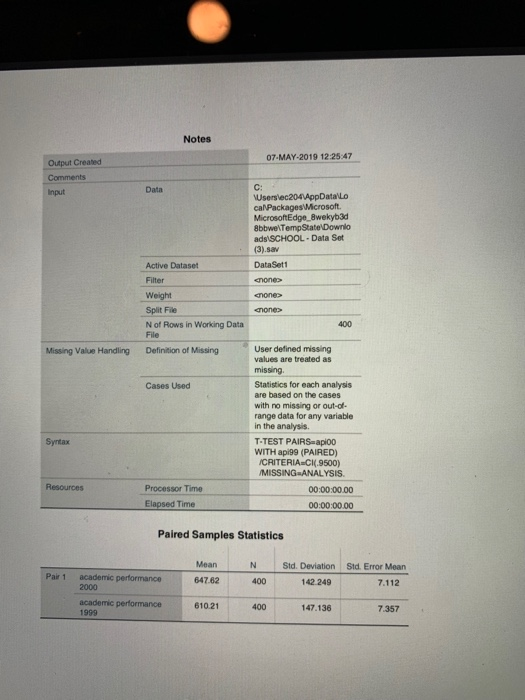
Notes 07-MAY-2019 12:25:47 Output Created C: Data MicrosoftEdge 8wekyb3d 8bbwelTempStateDownlo adsiSCHOOL-Data Set (3).sa DataSett Active Dataset Filter Weight Split File N of Rows in Working Data 400 File User defined missing values are treated as Missing Value Handling Definition of Missing missing Statistics for each analysis are based on the cases with no missing or out-of- range data for any variable in the analysis. T-TEST PAIRS-api00 WITH api99 (PAIRED) Cases Used CRITERIA-Cl(9500) MISSING ANALYSIS Processor Time 00:00:00.00 Elapsed Time 00:00:00.00 Paired Samples Statistics Mean 647.62 610.21 N Std. Deviation Std. Error Mean Pair 1 academic 400 142 249 7.112 2000 academic performance 1999 400 47.136 7.357
Paired Samples Correlations N Correlation Sig. 400 985 academic performance 2000 & academic Par 1 1999 Paired Samples Test Paired Diferences 95% Confidence... Mean Std. Deviation Std. Error Mean 25.247 34.928 1.262 37.410 2000 academic 1999 Paired Samples Test Paired 95% Confidence Interval of the Upper Sig (2tailed) 39.892 29.635 399 2000- academic 1999
Homework Answers
1a) There is a statistically significant difference in academic performance in 2000 according to the socioeconomic standing of the school as measured by the percentage of students that receive free meals.
Reason:
(Note: This is answered based on the result of one way anova (or F test). The null hypothesis and alternate hypothesis of the same are as follows
Ho:There is no difference in academic performance in 2000 according to the socioeconomic standing of the school as measured by the percentage of students that receive free meals. (i.e average percentage of group 1 =average percentage of group 2 =average percentage of group 3)
H1: There is a significant difference in academic performance in
2000 according to the socioeconomic standing of the school as
measured by the percentage of students that receive free meals of
at least 2 groups. (i.e average percentage of group 1 

From the results of one way anova (1st image), it can be seen that the p-value of the test (Denoted as sig) is .000. This p- value is less than 0.05 (assuming that we are allowing an error of 5%), therefore we reject the null hypothesis of the F Test (or ANOVA) and conclude that there is a statistically significant difference in academic performance in 2000 according to the socioeconomic standing of the school as measured by the percentage of students that receive free meals of at least 2 groups
Tukey HSD Test : This test is used to find dout which of the groups are significantly different. In the given problem there are 3 groups , and we know that there is a statistically significant difference in academic performance in 2000 according to the socioeconomic standing of the school as measured by the percentage of students that receive free meals of at least 2 groups. But we do not know which of the two groups differ significantly in academic performance. This is achieved with the help of Tukey HSD test which tests if there is a difference in the academic performance among each of the groups.
Ho: There is a significant difference in academic performance of the group1 and group2 (The same is applicable for all the groups. And the comparison for each pair of groups is given above in the test result)
H1: There is no significant difference in academic performance of the group1 and group2 (The same is applicable for all the groups. And the comparison for each pair of groups is given above in the test result)
(The interpretation given below is applicablle for all the pairs of groups since the p value is the same for all)
It can be seen that the p-value of the test (Denoted as sig) is .000. This p- value is less than 0.05 (assuming that we are allowing an error of 5%), therefore we reject the null hypothesis of the Tuckey HSD test and conclude that there is a statistically significant difference in academic performance in 2000 according to the socioeconomic standing of the school as measured by the percentage of students that receive free meals among every pair of group.
(Note: If the p- value is greater than 0.05 (assuming that we are allowing an error of 5%), we can accpet the null hypothesis of the Tuckey HSD test and conclude that there is a statistically significant difference in academic performance in 2000 according to the socioeconomic standing of the school as measured by the percentage of students that receive free meals among those groups).
1b) There a statistically significant difference in academic performance in 1999 between year-round and non-year-round schools.
Reason: Note that before conducting the independent sample t-test, we have to test the Equality of variance among the two groups and only then we can conduct the independent sample t-test.
The null and alternate hypothesis of Levene's test is as follows.
Ho: The variance of the academic performance in 1999 between year-round and non-year-round is equal
H1: The variance of the academic performance in 1999 between year-round and non-year-round is not equal
It can be seen that the p-value of the test (Denoted as sig) is .000. This p- value is less than 0.05 (assuming that we are allowing an error of 5%), therefore we reject the null hypothesis of Levene's test and conclude that "The variance of the academic performance in 1999 between year-round and non-year-round is not equal"
Now we can proceed to the results of " independent sample t-test"
The null and alternate hypothesis of independent sample t-test is as follows.
Ho: The average academic performance in 1999 between year-round and non-year-round is equal
H1: The average academic performance in 1999 between year-round and non-year-round is not equal
Since from the results of Levene's test we know that "he variance of the academic performance in 1999 between year-round and non-year-round is not equal". we should interpret the results of the T- test corresponding to "Unequal variances assumed".
It can be seen that the p-value of the test (Denoted as sig) is .000. This p- value is less than 0.05 (assuming that we are allowing an error of 5%), therefore we reject the null hypothesis of T- test and conclude that "The average academic performance in 1999 between year-round and non-year-round is not equal"
1c) es
The null and alternate hypothesis of Pearson's correlation test is as follows.
Ho: There is a significant relationship between academic performance in 2000 and the number of students.
H1: There is no significant relationship between academic performance in 2000 and the number of students.
It can be seen that the p-value of the test (Denoted as sig) is .000. This p- value is less than 0.05 (assuming that we are allowing an error of 5%), therefore we reject the null hypothesis and conclude that "There is no significant relationship between academic performance in 2000 and the number of students". The value of Pearson's correlation coefficient is also -.318 supporting the fact that "There is no significant relationship between academic performance in 2000 and the number of students."
(1d) Year-round status does not make a difference in the socioeconomic status of the school.
The null and alternate hypothesis of Chi square test is as follows.
Ho: There is a significant relationship between Year-round status and socioeconomic status of the school.
H1: There is no significant relationship between Year-round status and socioeconomic status of the school.
It can be seen that the p-value of the test (Denoted as sig) is .000. This p- value is less than 0.05 (assuming that we are allowing an error of 5%), therefore we reject the null hypothesis and conclude that "There is a significant relationship between Year-round status and socioeconomic status of the school.".
2) There is a statistically significant difference in academic performance from 1999 to academic performance in 2000
The null and alternate hypothesis of Paired T test is as follows.
Ho: There is a statistically significant difference in academic performance from 1999 to academic performance in 2000
H1: There is no statistically significant difference in academic performance from 1999 to academic performance in 2000
It can be seen that the p-value of the test (Denoted as sig) is .000. This p- value is less than 0.05 (assuming that we are allowing an error of 5%), therefore we reject the null hypothesis and conclude that "There is a statistically significant difference in academic performance from 1999 to academic performance in 2000".
Add Answer to:
look at each test on pic above and answer the question below: Interpret the result in APA stat (1a) Is there a statistically significant difference in academic performance in 2000...
What does the five number tell us about the time spent on email (Hint, interpret the...
 What does the five number tell us about the time spent on email
(Hint, interpret the five number summary in plain English) and what
does the Boxplot and the normality test show? Explain.
Use the 1.5xIQR rule to identify possible outliers. List the
cutoff points for outliers, Show your workings. Explain what you
found out. (Hint: Are there any excessive time spent on email for
Male(1) or Female(2) or both).
GET DATA /TYPE-XLS /FILE='C: \Users\rmanda 1 \ Desktop\homework! . xls'...
What does the five number tell us about the time spent on email
(Hint, interpret the five number summary in plain English) and what
does the Boxplot and the normality test show? Explain.
Use the 1.5xIQR rule to identify possible outliers. List the
cutoff points for outliers, Show your workings. Explain what you
found out. (Hint: Are there any excessive time spent on email for
Male(1) or Female(2) or both).
GET DATA /TYPE-XLS /FILE='C: \Users\rmanda 1 \ Desktop\homework! . xls'...
Most questions answered within 3 hours.
-
Where is the error in this code sequence?
String s1 = "Hello";
String s2 = "ello";...
asked 10 months ago -
Financial data for Joel de Paris, Inc., for last year
follow:
Joel de Paris, Inc.
Balance...
asked 10 months ago -
Consider this reaction:
Al2(SO4)3 (aq)+ BaCl3
(aq) Al2Cl6 (aq)- +
3BaSO4(s) . What is the...
asked 10 months ago -
Suppose that Savneet is considering increasing her
recent random sample from 20 car rentals to 40...
asked 10 months ago -
Trucks arrive at an unloading terminal at an average rate of 120
per hour.
Trucks arrive...
asked 10 months ago -
Why are methanol and ethanol completely soluble in water while
octanol is not very little soluble....
asked 10 months ago -
A facilities manager at a university reads in a research report
that the mean amount of...
asked 10 months ago -
When the CuSO4 is rehydrated by adding water to the anhydrous
compound, is this an endothermic...
asked 10 months ago -
A ray of sunlight is passing from diamond into crown glass; the
angle of incidence is...
asked 10 months ago -
A block of mass 0.249 kg is placed on top of a light, vertical
spring of...
asked 10 months ago -
how do the kidneys compensate in the presences of acidosis
a) trigger hyperventilate
b) reserve acid...
asked 10 months ago -
Question 501 pts
The rental rate of capital to the firm increases. Which of the
following...
asked 10 months ago