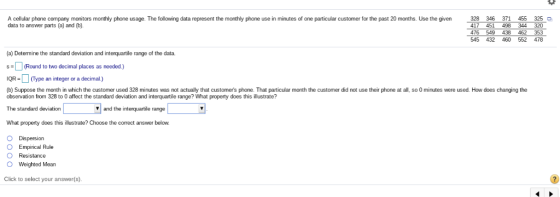
A cellular phone company monitors monthly phone usage. The following data represent the monthly phone use in minutes of one particular customer for the past 20 months. Use the given data to answer parts (a) and (b).
$$ \begin{array}{lllll} 328 & 346 & 371 & 455 & 325 \\ \hline 417 & 451 & 498 & 344 & 320 \\ \hline 476 & 549 & 438 & 462 & 353 \\ \hline 545 & 432 & 460 & 552 & 478 \end{array} $$
(a) Determine the standard deviation and interquartile range of the data.
(b) Suppose the month in which the customer used 328 minutes was not actually that customer's phone. That particular month the customer did not use their phone at all, so 0 minutes were used. How does changing the observation from 328 to 0 affect the standard deviation and interquartile range? What property does this illustrate?
The standard deviation _______ and the interquartile range _______
What property does this illustrate? Choose the correct answer below.
Dispersion
Empirical Rule
Resistance
Weighted Mean
Homework Answers
Mean = (328+346+371+455+325+417+451+498+344+320+476+549+438+462+353+545+432+460+552+478) / 20
= 430
Standard deviation = sqrt[[(328 - 430)2 +(346 - 430)2 +(371 - 430)2 +(455 - 430)2 +(325 - 430)2 +(417 - 430)2 +(451 - 430)2 +(498 - 430)2 +(344 - 430)2 +(320 - 430)2 +(476 - 430)2 +(549 - 430)2 +(438 - 430)2 +(462 - 430)2 +(353 - 430)2 +(545 - 430)2 +(432 - 430)2 +(460 - 430)2 +(552 - 430)2 +(478 - 430)2 ] / 19 ]
= 76.75
Data in sorted order is,
320 325 328 344 346 353 371 417 432 438 451 455 460 462 476 478 498 545 549 552
The data will be divided into two halves as
320 325 328 344 346 353 371 417 432 438
451 455 460 462 476 478 498 545 549 552
The median of these two halves are Q1 and Q3
Q1 = Mean of 5th and 6th number = (346 + 353)/2 = 349.5
Q3 = Mean of 5th and 6th number = (476 + 478) / 2 = 477
IQR = Q3 - Q1 = 477 - 349.5 = 128 (Rounding to nearest integer)
If we change any observation from 328 to 0, standard deviation will increase as the data will now be more spread out.
This property is called Dispersion
Add Answer to:
A cellular phone company monitors monthly phone usage. The following data represent the monthly phone use in minutes of one particular customer for the past 20 months. Use the given data to answer pa...
A cellular phone company monitors monthly phone usage. The following data represent the monthly phone use...
 A cellular phone company monitors monthly phone usage. The following data represent the monthly phone use in minutes of one particular customer for the past 20 months. Use the given data to answer parts (a) and (b). 339 359 470 411 379 365 552 517 554 328 349 401 417 489372 466514 314 474 437 la) Determine the standard deviation and interquartile range of the data (Round to two decimal places as needed) IQR -(Type an integer or a decimal)...
A cellular phone company monitors monthly phone usage. The following data represent the monthly phone use...
 A cellular phone company monitors monthly phone usage. The following data represent the monthly phone use in minutes of 334 499 347 379 389 one particular customer for the past 20 months. Use the given data to answer parts (a) and (b). 395 524 373 331 509 332 487 491 466 441 519 501 359 478 403 sts (a) Determine the standard deviation and interquartile range of the data. (Round to two decimal places as needed) IQR(Type an integer or...
A cellular phone company monitors monthly phone usage. The following data represent the monthly phone use...
 A cellular phone company monitors monthly phone usage. The following data represent the monthly phone use in minutes of one particular customer for the past 20 months. Use the given data to answer parts (a) and (b). 339 456 425 478 549 556 505 544 446 472 449 521 545 445 468 367 431 394 408 496 (a) Determine the standard deviation and interquartile range of the data Sul (Round to two decimal places as needed.)
U A cellular phone company monitors monthly phone usage. The following data represent the monthly phone...
 U A cellular phone company monitors monthly phone usage. The following data represent the monthly phone use in minutes of one particular customer for the past 20 months. Use the given data to answer parts (a) and (b). 331 377 436 480 500 330 497 441 343 529 495 342 389 474 363 415 521 329 496 442 S (a) Determine the standard deviation and interquartile range of the data. (Round to two decimal places as needed.) IQR-(Type an integer...
Use the numbers under the first pic instead of the ones on the first screen. please...
 Use the numbers under the first pic instead of the ones on the
first screen. please and thanks.
A cellular phone company monitors monthly phone usage. The following data represent the monthly phone use in minutes of one particular customer for the past 20 months. Use the given data to answer parts (a) and (b). 330 439 543 432 389 335 499 488 498 418 493 420 529 481 480 545 483 526 513 547 (a) Determine the standard deviation...
Use the numbers under the first pic instead of the ones on the
first screen. please and thanks.
A cellular phone company monitors monthly phone usage. The following data represent the monthly phone use in minutes of one particular customer for the past 20 months. Use the given data to answer parts (a) and (b). 330 439 543 432 389 335 499 488 498 418 493 420 529 481 480 545 483 526 513 547 (a) Determine the standard deviation...
4). a.b. The weight of an organ in adult males has a bell-shaped distribution with a...
 4).
a.b.
The weight of an organ in adult males has a bell-shaped distribution with a mean of 325 grams and a standard deviation of 20 grams. Use the empirical rule to determine the following. (a) About 99.7% of organs will be between what weights? (b) What percentage of organs weighs between 305 grams and 345 grams? (c) What percentage of organs weighs less than 305 grams or more than 345 grams? (d) What percentage of organs weighs between 285...
4).
a.b.
The weight of an organ in adult males has a bell-shaped distribution with a mean of 325 grams and a standard deviation of 20 grams. Use the empirical rule to determine the following. (a) About 99.7% of organs will be between what weights? (b) What percentage of organs weighs between 305 grams and 345 grams? (c) What percentage of organs weighs less than 305 grams or more than 345 grams? (d) What percentage of organs weighs between 285...
HW Score: 78.69%, 12.59 of 16 pts Score: 0 of 1 pt 8 of 16 (15 complete) 3.4.25 Question Help * The following data represent the monthly phone use, n minutes, a customer en ed in a aud prevention pro...
 HW Score: 78.69%, 12.59 of 16 pts Score: 0 of 1 pt 8 of 16 (15 complete) 3.4.25 Question Help * The following data represent the monthly phone use, n minutes, a customer en ed in a aud prevention pro ram for the past 20 months. The phone c point for the number of minutes at which the customer should be contacted. What is the cutoff point? des touse the upper ence as the cutoff 386 510 449 522 ryde...
A national survey asked people, "How often do you eat out for dinner. (a) Construct a...
 A national survey asked people, "How often do you eat out for dinner. (a) Construct a relative frequency distribution of the data. instead of at home?" The frequencies were as follows. Complete parts (a) through (9) Relative Response Frequency Never Response Frequency Rarely Never 252 Sometimes Rarely 569 Most of the time Sometimes 966 Most of the time Always 371 Always (Round to three decimal places as needed.) 68 (b) What percentage of respondents answered "Always"? (Round to one decimal...
 A cellular phone company monitors monthly phone usage. The following data represent the monthly phone use in minutes of one particular customer for the past 20 months. Use the given data to answer parts (a) and (b). 339 359 470 411 379 365 552 517 554 328 349 401 417 489372 466514 314 474 437 la) Determine the standard deviation and interquartile range of the data (Round to two decimal places as needed) IQR -(Type an integer or a decimal)...
 A cellular phone company monitors monthly phone usage. The following data represent the monthly phone use in minutes of 334 499 347 379 389 one particular customer for the past 20 months. Use the given data to answer parts (a) and (b). 395 524 373 331 509 332 487 491 466 441 519 501 359 478 403 sts (a) Determine the standard deviation and interquartile range of the data. (Round to two decimal places as needed) IQR(Type an integer or...
 A cellular phone company monitors monthly phone usage. The following data represent the monthly phone use in minutes of one particular customer for the past 20 months. Use the given data to answer parts (a) and (b). 339 456 425 478 549 556 505 544 446 472 449 521 545 445 468 367 431 394 408 496 (a) Determine the standard deviation and interquartile range of the data Sul (Round to two decimal places as needed.)
 U A cellular phone company monitors monthly phone usage. The following data represent the monthly phone use in minutes of one particular customer for the past 20 months. Use the given data to answer parts (a) and (b). 331 377 436 480 500 330 497 441 343 529 495 342 389 474 363 415 521 329 496 442 S (a) Determine the standard deviation and interquartile range of the data. (Round to two decimal places as needed.) IQR-(Type an integer...
 Use the numbers under the first pic instead of the ones on the
first screen. please and thanks.
A cellular phone company monitors monthly phone usage. The following data represent the monthly phone use in minutes of one particular customer for the past 20 months. Use the given data to answer parts (a) and (b). 330 439 543 432 389 335 499 488 498 418 493 420 529 481 480 545 483 526 513 547 (a) Determine the standard deviation...
Use the numbers under the first pic instead of the ones on the
first screen. please and thanks.
A cellular phone company monitors monthly phone usage. The following data represent the monthly phone use in minutes of one particular customer for the past 20 months. Use the given data to answer parts (a) and (b). 330 439 543 432 389 335 499 488 498 418 493 420 529 481 480 545 483 526 513 547 (a) Determine the standard deviation...
 4).
a.b.
The weight of an organ in adult males has a bell-shaped distribution with a mean of 325 grams and a standard deviation of 20 grams. Use the empirical rule to determine the following. (a) About 99.7% of organs will be between what weights? (b) What percentage of organs weighs between 305 grams and 345 grams? (c) What percentage of organs weighs less than 305 grams or more than 345 grams? (d) What percentage of organs weighs between 285...
4).
a.b.
The weight of an organ in adult males has a bell-shaped distribution with a mean of 325 grams and a standard deviation of 20 grams. Use the empirical rule to determine the following. (a) About 99.7% of organs will be between what weights? (b) What percentage of organs weighs between 305 grams and 345 grams? (c) What percentage of organs weighs less than 305 grams or more than 345 grams? (d) What percentage of organs weighs between 285...
 HW Score: 78.69%, 12.59 of 16 pts Score: 0 of 1 pt 8 of 16 (15 complete) 3.4.25 Question Help * The following data represent the monthly phone use, n minutes, a customer en ed in a aud prevention pro ram for the past 20 months. The phone c point for the number of minutes at which the customer should be contacted. What is the cutoff point? des touse the upper ence as the cutoff 386 510 449 522 ryde...
 A national survey asked people, "How often do you eat out for dinner. (a) Construct a relative frequency distribution of the data. instead of at home?" The frequencies were as follows. Complete parts (a) through (9) Relative Response Frequency Never Response Frequency Rarely Never 252 Sometimes Rarely 569 Most of the time Sometimes 966 Most of the time Always 371 Always (Round to three decimal places as needed.) 68 (b) What percentage of respondents answered "Always"? (Round to one decimal...
Most questions answered within 3 hours.
-
Where is the error in this code sequence?
String s1 = "Hello";
String s2 = "ello";...
asked 11 months ago -
Financial data for Joel de Paris, Inc., for last year
follow:
Joel de Paris, Inc.
Balance...
asked 11 months ago -
Consider this reaction:
Al2(SO4)3 (aq)+ BaCl3
(aq) Al2Cl6 (aq)- +
3BaSO4(s) . What is the...
asked 11 months ago -
Suppose that Savneet is considering increasing her
recent random sample from 20 car rentals to 40...
asked 11 months ago -
Trucks arrive at an unloading terminal at an average rate of 120
per hour.
Trucks arrive...
asked 11 months ago -
Why are methanol and ethanol completely soluble in water while
octanol is not very little soluble....
asked 11 months ago -
A facilities manager at a university reads in a research report
that the mean amount of...
asked 11 months ago -
When the CuSO4 is rehydrated by adding water to the anhydrous
compound, is this an endothermic...
asked 11 months ago -
A ray of sunlight is passing from diamond into crown glass; the
angle of incidence is...
asked 11 months ago -
A block of mass 0.249 kg is placed on top of a light, vertical
spring of...
asked 11 months ago -
how do the kidneys compensate in the presences of acidosis
a) trigger hyperventilate
b) reserve acid...
asked 11 months ago -
Question 501 pts
The rental rate of capital to the firm increases. Which of the
following...
asked 11 months ago