
Homework Answers
From the Bode frequency response, it is observed that the initial roll off of the magnitude response is approximately 20 dB /decade.
One pole at origin is responsible for this decay of magnitude. Therefore there is one pole at origin.
It is observed that the high frequency roll off of the magnitude response is approximately 60 dB /decade. This means that there are a total 3 poles. Therefore the number of excess poles = 3 - 1 = 2.
From the initial magnitude response, it is observed that the initial magnitude at w = 0.1rad/sec is 0 dB approximately.
i.e. 20log(K) + 20log(0.1) = 0 dB = 1
=> 20 log(K) = -20 dB => K = 0.1.
From the bode response, the gain margin is computed as given below
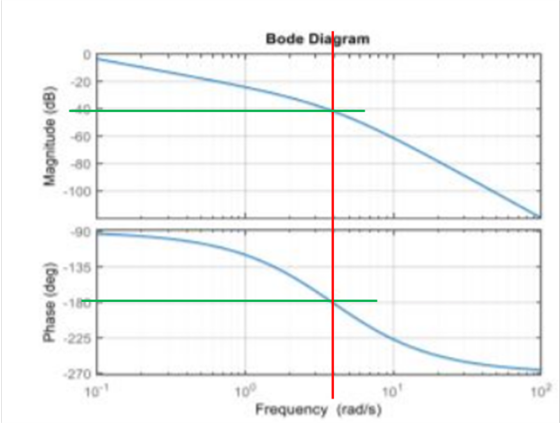
GM = - gain in dB at phase crossover frequency = -(-40 dB) = 40 dB
With K = 1, the magnitude response shifts upwards.
Therefore the new gain margin = 40- 20dB = 20 dB.
The transfer function is approximately given below based on the given information
T(s) = 0.1 /(s*(s+3)^2)
Add Answer to:
Consider the system given below where K is a constant gain, Gp is the plant, and Ge is a compensator. The Bode Plots of a Gp is given below. Problem 1: Bode Diagram 20 2 40 -60 80 -100 90 135 180 a 2...
The Bode plots for a plant, G(s), used in a unity feedback system are shown in Figure P10.7. Do the following: Find the gain margin, phase margin, zero dB frequency, 180° frequency, and the closed-l...
 The Bode plots for a plant, G(s), used in a unity feedback
system are shown in Figure P10.7. Do the following:
Find the gain margin, phase margin, zero dB frequency, 180°
frequency, and the closed-loop bandwidth.
Use your results in Part a to estimate the damping ratio,
percent overshoot, settling time, and peak time.
ANSWERS GIVEN BY PROFESSOR
1. Gain margin = 20dB, Phase margin = 55 deg, Zero dB frequency
= 1rad/s, 180deg frequency = 4.5rad/s, bandwidth (-7dB) closed-loop...
The Bode plots for a plant, G(s), used in a unity feedback
system are shown in Figure P10.7. Do the following:
Find the gain margin, phase margin, zero dB frequency, 180°
frequency, and the closed-loop bandwidth.
Use your results in Part a to estimate the damping ratio,
percent overshoot, settling time, and peak time.
ANSWERS GIVEN BY PROFESSOR
1. Gain margin = 20dB, Phase margin = 55 deg, Zero dB frequency
= 1rad/s, 180deg frequency = 4.5rad/s, bandwidth (-7dB) closed-loop...
Consider the system shown as below. Draw a Bode diagram of the open-loop transfer function G(s).
 1 Consider the system shown as below. Draw a Bode diagram of the open-loop transfer function G(s). Determine the phase margin, gain-crossover frequency, gain margin and phase-crossover frequency, (Sketch the bode diagram by hand) 2 Consider the system shown as below. Use MATLAB to draw a bode diagram of the open-loop transfer function G(s). Show the gain-crossover frequency and phase-crossover frequency in the Bode diagram and determine the phase margin and gain margin. 3. Consider the system shown as below. Design a...
ASAP ble 3 20 Pts. A transfer function Bode p ots are shown below. Answer the...
 ASAP
ble 3 20 Pts. A transfer function Bode p ots are shown below. Answer the following questions; please eatly draw the appropriate lines as needed, show your work and write your answers in the provided table a. What is the gain margin in dB? b. What is the phase margin in degrees? c. What is the ultimate gain Keu in dB? Also, convert Kc back from dB to a regular gain value. d. What is the ultimate frequency wy...
ASAP
ble 3 20 Pts. A transfer function Bode p ots are shown below. Answer the following questions; please eatly draw the appropriate lines as needed, show your work and write your answers in the provided table a. What is the gain margin in dB? b. What is the phase margin in degrees? c. What is the ultimate gain Keu in dB? Also, convert Kc back from dB to a regular gain value. d. What is the ultimate frequency wy...
7.5 (2 points) Given the Bode plot shown below: Bode Diagram 50 -50 E -100 150 O 45 a -90 135 180...
 7.5 (2 points) Given the Bode plot shown below: Bode Diagram 50 -50 E -100 150 O 45 a -90 135 180 10 102 Frequency (radis) 103 10 10 10 Find the associated transfer function Gs).Enter your answer symbolically in terms of s. For proper grading, do not factor out terms in the numerator or denominator, e.g., enter 5-+1015 and not5- (+2+3. G(s)-
7.5 (2 points) Given the Bode plot shown below: Bode Diagram 50 -50 E -100 150 O...
7.5 (2 points) Given the Bode plot shown below: Bode Diagram 50 -50 E -100 150 O 45 a -90 135 180 10 102 Frequency (radis) 103 10 10 10 Find the associated transfer function Gs).Enter your answer symbolically in terms of s. For proper grading, do not factor out terms in the numerator or denominator, e.g., enter 5-+1015 and not5- (+2+3. G(s)-
7.5 (2 points) Given the Bode plot shown below: Bode Diagram 50 -50 E -100 150 O...
KKKM3473/KKKM3314/KKKM3344 The characteristic polynomial of a feedback control system is given by 5. where K>0. Dete...
 KKKM3473/KKKM3314/KKKM3344 The characteristic polynomial of a feedback control system is given by 5. where K>0. Determine the range of values of K for which the system is stable. (10 marks) The closed loop poles of a second order system are located at points -3.5+1.5t and 6. -3.5-1.51 on the complex plane. Calculate the damped natural frequency, ωd. (10 marks) 7. The Bode plots for a first order dynamic system is shown in Figure 3. Estimate the magnitude and phase when...
 The Bode plots for a plant, G(s), used in a unity feedback
system are shown in Figure P10.7. Do the following:
Find the gain margin, phase margin, zero dB frequency, 180°
frequency, and the closed-loop bandwidth.
Use your results in Part a to estimate the damping ratio,
percent overshoot, settling time, and peak time.
ANSWERS GIVEN BY PROFESSOR
1. Gain margin = 20dB, Phase margin = 55 deg, Zero dB frequency
= 1rad/s, 180deg frequency = 4.5rad/s, bandwidth (-7dB) closed-loop...
The Bode plots for a plant, G(s), used in a unity feedback
system are shown in Figure P10.7. Do the following:
Find the gain margin, phase margin, zero dB frequency, 180°
frequency, and the closed-loop bandwidth.
Use your results in Part a to estimate the damping ratio,
percent overshoot, settling time, and peak time.
ANSWERS GIVEN BY PROFESSOR
1. Gain margin = 20dB, Phase margin = 55 deg, Zero dB frequency
= 1rad/s, 180deg frequency = 4.5rad/s, bandwidth (-7dB) closed-loop...
 ASAP
ble 3 20 Pts. A transfer function Bode p ots are shown below. Answer the following questions; please eatly draw the appropriate lines as needed, show your work and write your answers in the provided table a. What is the gain margin in dB? b. What is the phase margin in degrees? c. What is the ultimate gain Keu in dB? Also, convert Kc back from dB to a regular gain value. d. What is the ultimate frequency wy...
ASAP
ble 3 20 Pts. A transfer function Bode p ots are shown below. Answer the following questions; please eatly draw the appropriate lines as needed, show your work and write your answers in the provided table a. What is the gain margin in dB? b. What is the phase margin in degrees? c. What is the ultimate gain Keu in dB? Also, convert Kc back from dB to a regular gain value. d. What is the ultimate frequency wy...
 7.5 (2 points) Given the Bode plot shown below: Bode Diagram 50 -50 E -100 150 O 45 a -90 135 180 10 102 Frequency (radis) 103 10 10 10 Find the associated transfer function Gs).Enter your answer symbolically in terms of s. For proper grading, do not factor out terms in the numerator or denominator, e.g., enter 5-+1015 and not5- (+2+3. G(s)-
7.5 (2 points) Given the Bode plot shown below: Bode Diagram 50 -50 E -100 150 O...
7.5 (2 points) Given the Bode plot shown below: Bode Diagram 50 -50 E -100 150 O 45 a -90 135 180 10 102 Frequency (radis) 103 10 10 10 Find the associated transfer function Gs).Enter your answer symbolically in terms of s. For proper grading, do not factor out terms in the numerator or denominator, e.g., enter 5-+1015 and not5- (+2+3. G(s)-
7.5 (2 points) Given the Bode plot shown below: Bode Diagram 50 -50 E -100 150 O...
 KKKM3473/KKKM3314/KKKM3344 The characteristic polynomial of a feedback control system is given by 5. where K>0. Determine the range of values of K for which the system is stable. (10 marks) The closed loop poles of a second order system are located at points -3.5+1.5t and 6. -3.5-1.51 on the complex plane. Calculate the damped natural frequency, ωd. (10 marks) 7. The Bode plots for a first order dynamic system is shown in Figure 3. Estimate the magnitude and phase when...
Most questions answered within 3 hours.
-
Where is the error in this code sequence?
String s1 = "Hello";
String s2 = "ello";...
asked 11 months ago -
Financial data for Joel de Paris, Inc., for last year
follow:
Joel de Paris, Inc.
Balance...
asked 11 months ago -
Consider this reaction:
Al2(SO4)3 (aq)+ BaCl3
(aq) Al2Cl6 (aq)- +
3BaSO4(s) . What is the...
asked 11 months ago -
Suppose that Savneet is considering increasing her
recent random sample from 20 car rentals to 40...
asked 11 months ago -
Trucks arrive at an unloading terminal at an average rate of 120
per hour.
Trucks arrive...
asked 11 months ago -
Why are methanol and ethanol completely soluble in water while
octanol is not very little soluble....
asked 11 months ago -
A facilities manager at a university reads in a research report
that the mean amount of...
asked 11 months ago -
When the CuSO4 is rehydrated by adding water to the anhydrous
compound, is this an endothermic...
asked 11 months ago -
A ray of sunlight is passing from diamond into crown glass; the
angle of incidence is...
asked 11 months ago -
A block of mass 0.249 kg is placed on top of a light, vertical
spring of...
asked 11 months ago -
how do the kidneys compensate in the presences of acidosis
a) trigger hyperventilate
b) reserve acid...
asked 11 months ago -
Question 501 pts
The rental rate of capital to the firm increases. Which of the
following...
asked 11 months ago