

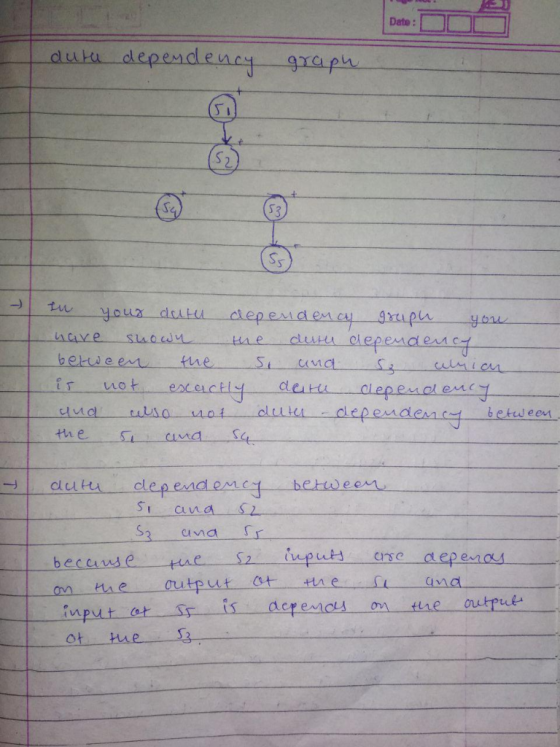
Is this dependency graph and pipeline diagram correct? Please explain in details.
ex) Sa 53 SK S5
Homework Answers
Solution::

Add Answer to:
Is this dependency graph and pipeline diagram correct? Please explain in details. ionce Sider the ex) Sa 53 SK S5...
Please graph clearly with labels and follow the instruction. Indicate the correct answer and explain why....
 Please graph clearly with labels and follow the instruction.
Indicate the correct answer and explain why. Thank you!
The graph shows the demand curve, marginal revenue curve, and marginal cost curve of Walk Fit, Inc., a producer of hiking boots in monopolistic competition Draw a point at the firm's profit-maximizing price and quantity. Draw a vertical arrow that shows the firm's markup Draw a shape that shows the firm's economic profit Price and cost(dollars per pair) MC ATC Walk Fits...
Please graph clearly with labels and follow the instruction.
Indicate the correct answer and explain why. Thank you!
The graph shows the demand curve, marginal revenue curve, and marginal cost curve of Walk Fit, Inc., a producer of hiking boots in monopolistic competition Draw a point at the firm's profit-maximizing price and quantity. Draw a vertical arrow that shows the firm's markup Draw a shape that shows the firm's economic profit Price and cost(dollars per pair) MC ATC Walk Fits...
could you please explain how to do this? maybe by drawing a graph and add details...
 could you please explain how
to do this? maybe by drawing a graph and add details that showing
where each group goes. thank you
2) sketch what you would expect the 1 H NMR of the following compound to look like, label all of the protons on the structure and correspondingly on the spectra, you draw, make sure to include chemical shift, integration values and splitting patterns for your spectra (8points)
could you please explain how
to do this? maybe by drawing a graph and add details that showing
where each group goes. thank you
2) sketch what you would expect the 1 H NMR of the following compound to look like, label all of the protons on the structure and correspondingly on the spectra, you draw, make sure to include chemical shift, integration values and splitting patterns for your spectra (8points)
PLEASE WRITE NEATLY AND EXPLAIN YOUR ANSWER IN DETAILS. THANK YOU! 2) Given the following graph...
 PLEASE WRITE NEATLY AND EXPLAIN YOUR ANSWER IN DETAILS. THANK
YOU!
2) Given the following graph of NPV *y axis) v interest rate (x axis), what is a "reasonable" i* value? Would you say that this investment is acceptable if the MARR (minimum Attractive Rate or Return) is 10%? 600 0.4 0.6 0.8 100+
PLEASE WRITE NEATLY AND EXPLAIN YOUR ANSWER IN DETAILS. THANK
YOU!
2) Given the following graph of NPV *y axis) v interest rate (x axis), what is a "reasonable" i* value? Would you say that this investment is acceptable if the MARR (minimum Attractive Rate or Return) is 10%? 600 0.4 0.6 0.8 100+
please provide the correct answer and explain how to solve. thank you w Algebra Task D jig sa D Task Case 2 Case 1 C...
 please provide the correct answer and explain how to solve. thank
you
w Algebra Task D jig sa D Task Case 2 Case 1 Case 3
please provide the correct answer and explain how to solve. thank
you
w Algebra Task D jig sa D Task Case 2 Case 1 Case 3
Please explain in details with step by step solution, Thank you very much ) Assume a...
 Please explain in details with step by step solution, Thank you
very much
) Assume a monopolist faces a market demand curve P 100 - 2Q and has the short-run total cost function C 640+20Q. i) What is the profit-maximizing level of output? What is the profits? Graph the marginal revenue, marginal cost, and demand curves, and show the area that (7 Marks) In Question f (i), what would price and output be if the firm priced at socially represents...
Please explain in details with step by step solution, Thank you
very much
) Assume a monopolist faces a market demand curve P 100 - 2Q and has the short-run total cost function C 640+20Q. i) What is the profit-maximizing level of output? What is the profits? Graph the marginal revenue, marginal cost, and demand curves, and show the area that (7 Marks) In Question f (i), what would price and output be if the firm priced at socially represents...
the graph is drawn by me, not sure if it's correct. please answer asap. Yow hike...
 the graph is drawn by me, not sure if it's correct.
please answer asap.
Yow hike to a position 70 miles from the origin, at an angle of -35 degrees (or 325 degrees). all this iniial displacemen R, From this kocation, you hike through an unknown displacement. R You end ve a apustion 8.0 miles from the origin, at an angle of 250 degrees. This your resultant aglacement vector R·ia) Make a diagram showing all three vectors roughly to scale,...
the graph is drawn by me, not sure if it's correct.
please answer asap.
Yow hike to a position 70 miles from the origin, at an angle of -35 degrees (or 325 degrees). all this iniial displacemen R, From this kocation, you hike through an unknown displacement. R You end ve a apustion 8.0 miles from the origin, at an angle of 250 degrees. This your resultant aglacement vector R·ia) Make a diagram showing all three vectors roughly to scale,...
please explain in details and please show how u did it .thank u Part III. (3...
 please explain in details and please show how u did it
.thank u
Part III. (3 points) Redraw the diagram describing a competitive firm, and answer the questions below. think Price 0 11. After labeling each curve, select/mark how much the profit-maximizing firm should produce. (1 point) 12. Identify/draw the area showing total profit at the level of output selected in #11 (1 point) JOT SHARE 13. In the long run, if the firms stays in the market, it will...
please explain in details and please show how u did it
.thank u
Part III. (3 points) Redraw the diagram describing a competitive firm, and answer the questions below. think Price 0 11. After labeling each curve, select/mark how much the profit-maximizing firm should produce. (1 point) 12. Identify/draw the area showing total profit at the level of output selected in #11 (1 point) JOT SHARE 13. In the long run, if the firms stays in the market, it will...
please help with these graphs explain the details so I cam understand Long Run Profits Real...
 please help with these graphs
explain the details so I cam understand
Long Run Profits Real world examples Draw the complete graph for each question. (Label everything.) (done in class) .Suppose the market for minivans is initially at equilibrium. Suppose now the price of SUV's (sport utility vehicles) increases. Draw a diagram to show the impact on the new equilibrium price and quantity of minivans Suppose the market for minivans is initially at equilibrium. Suppose now a strike by steelworkers...
please help with these graphs
explain the details so I cam understand
Long Run Profits Real world examples Draw the complete graph for each question. (Label everything.) (done in class) .Suppose the market for minivans is initially at equilibrium. Suppose now the price of SUV's (sport utility vehicles) increases. Draw a diagram to show the impact on the new equilibrium price and quantity of minivans Suppose the market for minivans is initially at equilibrium. Suppose now a strike by steelworkers...
The correct answer to the following question is WACC= 4.55%. Please explain with full details &...
 The correct answer to the following question is
WACC= 4.55%. Please explain with full
details & thank you:
2. A company has a market value of equity of $3,200,000 and one million shares outstanding. The company also has issued bonds with a face value of $2 million. The bonds have a coupon rate of 4% p.a. and coupons are paid every six months. A coupon was just paid today. The bonds were issued five years ago and have a maturity...
The correct answer to the following question is
WACC= 4.55%. Please explain with full
details & thank you:
2. A company has a market value of equity of $3,200,000 and one million shares outstanding. The company also has issued bonds with a face value of $2 million. The bonds have a coupon rate of 4% p.a. and coupons are paid every six months. A coupon was just paid today. The bonds were issued five years ago and have a maturity...
Please explain in details with step by step solution, Thank you very much a) Because of...
 Please explain in details with step by step solution, Thank you
very much
a) Because of my heavy teaching load this term, I did not have time to finish the table below, which relates output and cost. Please do it for me. The marginal cost figures refer to the marginal cost of moving from the previous unit to the unit of the row specified. Quantity Total Fixed Variable AverageAverageAverage Marginal (Q) Cost Cost Cost Cost Fixed Cost Variable Cost (TC)...
Please explain in details with step by step solution, Thank you
very much
a) Because of my heavy teaching load this term, I did not have time to finish the table below, which relates output and cost. Please do it for me. The marginal cost figures refer to the marginal cost of moving from the previous unit to the unit of the row specified. Quantity Total Fixed Variable AverageAverageAverage Marginal (Q) Cost Cost Cost Cost Fixed Cost Variable Cost (TC)...
 Please graph clearly with labels and follow the instruction.
Indicate the correct answer and explain why. Thank you!
The graph shows the demand curve, marginal revenue curve, and marginal cost curve of Walk Fit, Inc., a producer of hiking boots in monopolistic competition Draw a point at the firm's profit-maximizing price and quantity. Draw a vertical arrow that shows the firm's markup Draw a shape that shows the firm's economic profit Price and cost(dollars per pair) MC ATC Walk Fits...
Please graph clearly with labels and follow the instruction.
Indicate the correct answer and explain why. Thank you!
The graph shows the demand curve, marginal revenue curve, and marginal cost curve of Walk Fit, Inc., a producer of hiking boots in monopolistic competition Draw a point at the firm's profit-maximizing price and quantity. Draw a vertical arrow that shows the firm's markup Draw a shape that shows the firm's economic profit Price and cost(dollars per pair) MC ATC Walk Fits...
 could you please explain how
to do this? maybe by drawing a graph and add details that showing
where each group goes. thank you
2) sketch what you would expect the 1 H NMR of the following compound to look like, label all of the protons on the structure and correspondingly on the spectra, you draw, make sure to include chemical shift, integration values and splitting patterns for your spectra (8points)
could you please explain how
to do this? maybe by drawing a graph and add details that showing
where each group goes. thank you
2) sketch what you would expect the 1 H NMR of the following compound to look like, label all of the protons on the structure and correspondingly on the spectra, you draw, make sure to include chemical shift, integration values and splitting patterns for your spectra (8points)
 PLEASE WRITE NEATLY AND EXPLAIN YOUR ANSWER IN DETAILS. THANK
YOU!
2) Given the following graph of NPV *y axis) v interest rate (x axis), what is a "reasonable" i* value? Would you say that this investment is acceptable if the MARR (minimum Attractive Rate or Return) is 10%? 600 0.4 0.6 0.8 100+
PLEASE WRITE NEATLY AND EXPLAIN YOUR ANSWER IN DETAILS. THANK
YOU!
2) Given the following graph of NPV *y axis) v interest rate (x axis), what is a "reasonable" i* value? Would you say that this investment is acceptable if the MARR (minimum Attractive Rate or Return) is 10%? 600 0.4 0.6 0.8 100+
 please provide the correct answer and explain how to solve. thank
you
w Algebra Task D jig sa D Task Case 2 Case 1 Case 3
please provide the correct answer and explain how to solve. thank
you
w Algebra Task D jig sa D Task Case 2 Case 1 Case 3
 Please explain in details with step by step solution, Thank you
very much
) Assume a monopolist faces a market demand curve P 100 - 2Q and has the short-run total cost function C 640+20Q. i) What is the profit-maximizing level of output? What is the profits? Graph the marginal revenue, marginal cost, and demand curves, and show the area that (7 Marks) In Question f (i), what would price and output be if the firm priced at socially represents...
Please explain in details with step by step solution, Thank you
very much
) Assume a monopolist faces a market demand curve P 100 - 2Q and has the short-run total cost function C 640+20Q. i) What is the profit-maximizing level of output? What is the profits? Graph the marginal revenue, marginal cost, and demand curves, and show the area that (7 Marks) In Question f (i), what would price and output be if the firm priced at socially represents...
 the graph is drawn by me, not sure if it's correct.
please answer asap.
Yow hike to a position 70 miles from the origin, at an angle of -35 degrees (or 325 degrees). all this iniial displacemen R, From this kocation, you hike through an unknown displacement. R You end ve a apustion 8.0 miles from the origin, at an angle of 250 degrees. This your resultant aglacement vector R·ia) Make a diagram showing all three vectors roughly to scale,...
the graph is drawn by me, not sure if it's correct.
please answer asap.
Yow hike to a position 70 miles from the origin, at an angle of -35 degrees (or 325 degrees). all this iniial displacemen R, From this kocation, you hike through an unknown displacement. R You end ve a apustion 8.0 miles from the origin, at an angle of 250 degrees. This your resultant aglacement vector R·ia) Make a diagram showing all three vectors roughly to scale,...
 please explain in details and please show how u did it
.thank u
Part III. (3 points) Redraw the diagram describing a competitive firm, and answer the questions below. think Price 0 11. After labeling each curve, select/mark how much the profit-maximizing firm should produce. (1 point) 12. Identify/draw the area showing total profit at the level of output selected in #11 (1 point) JOT SHARE 13. In the long run, if the firms stays in the market, it will...
please explain in details and please show how u did it
.thank u
Part III. (3 points) Redraw the diagram describing a competitive firm, and answer the questions below. think Price 0 11. After labeling each curve, select/mark how much the profit-maximizing firm should produce. (1 point) 12. Identify/draw the area showing total profit at the level of output selected in #11 (1 point) JOT SHARE 13. In the long run, if the firms stays in the market, it will...
 please help with these graphs
explain the details so I cam understand
Long Run Profits Real world examples Draw the complete graph for each question. (Label everything.) (done in class) .Suppose the market for minivans is initially at equilibrium. Suppose now the price of SUV's (sport utility vehicles) increases. Draw a diagram to show the impact on the new equilibrium price and quantity of minivans Suppose the market for minivans is initially at equilibrium. Suppose now a strike by steelworkers...
please help with these graphs
explain the details so I cam understand
Long Run Profits Real world examples Draw the complete graph for each question. (Label everything.) (done in class) .Suppose the market for minivans is initially at equilibrium. Suppose now the price of SUV's (sport utility vehicles) increases. Draw a diagram to show the impact on the new equilibrium price and quantity of minivans Suppose the market for minivans is initially at equilibrium. Suppose now a strike by steelworkers...
 The correct answer to the following question is
WACC= 4.55%. Please explain with full
details & thank you:
2. A company has a market value of equity of $3,200,000 and one million shares outstanding. The company also has issued bonds with a face value of $2 million. The bonds have a coupon rate of 4% p.a. and coupons are paid every six months. A coupon was just paid today. The bonds were issued five years ago and have a maturity...
The correct answer to the following question is
WACC= 4.55%. Please explain with full
details & thank you:
2. A company has a market value of equity of $3,200,000 and one million shares outstanding. The company also has issued bonds with a face value of $2 million. The bonds have a coupon rate of 4% p.a. and coupons are paid every six months. A coupon was just paid today. The bonds were issued five years ago and have a maturity...
 Please explain in details with step by step solution, Thank you
very much
a) Because of my heavy teaching load this term, I did not have time to finish the table below, which relates output and cost. Please do it for me. The marginal cost figures refer to the marginal cost of moving from the previous unit to the unit of the row specified. Quantity Total Fixed Variable AverageAverageAverage Marginal (Q) Cost Cost Cost Cost Fixed Cost Variable Cost (TC)...
Please explain in details with step by step solution, Thank you
very much
a) Because of my heavy teaching load this term, I did not have time to finish the table below, which relates output and cost. Please do it for me. The marginal cost figures refer to the marginal cost of moving from the previous unit to the unit of the row specified. Quantity Total Fixed Variable AverageAverageAverage Marginal (Q) Cost Cost Cost Cost Fixed Cost Variable Cost (TC)...
Most questions answered within 3 hours.
-
Where is the error in this code sequence?
String s1 = "Hello";
String s2 = "ello";...
asked 10 months ago -
Financial data for Joel de Paris, Inc., for last year
follow:
Joel de Paris, Inc.
Balance...
asked 10 months ago -
Consider this reaction:
Al2(SO4)3 (aq)+ BaCl3
(aq) Al2Cl6 (aq)- +
3BaSO4(s) . What is the...
asked 10 months ago -
Suppose that Savneet is considering increasing her
recent random sample from 20 car rentals to 40...
asked 10 months ago -
Trucks arrive at an unloading terminal at an average rate of 120
per hour.
Trucks arrive...
asked 10 months ago -
Why are methanol and ethanol completely soluble in water while
octanol is not very little soluble....
asked 10 months ago -
A facilities manager at a university reads in a research report
that the mean amount of...
asked 10 months ago -
When the CuSO4 is rehydrated by adding water to the anhydrous
compound, is this an endothermic...
asked 10 months ago -
A ray of sunlight is passing from diamond into crown glass; the
angle of incidence is...
asked 10 months ago -
A block of mass 0.249 kg is placed on top of a light, vertical
spring of...
asked 10 months ago -
how do the kidneys compensate in the presences of acidosis
a) trigger hyperventilate
b) reserve acid...
asked 10 months ago -
Question 501 pts
The rental rate of capital to the firm increases. Which of the
following...
asked 10 months ago