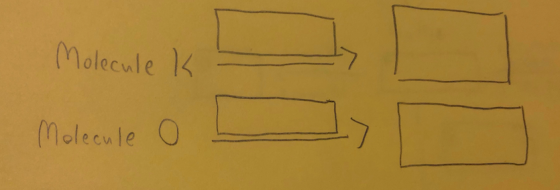
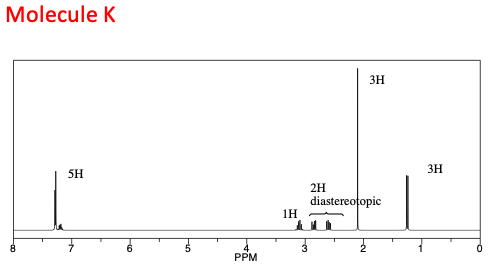
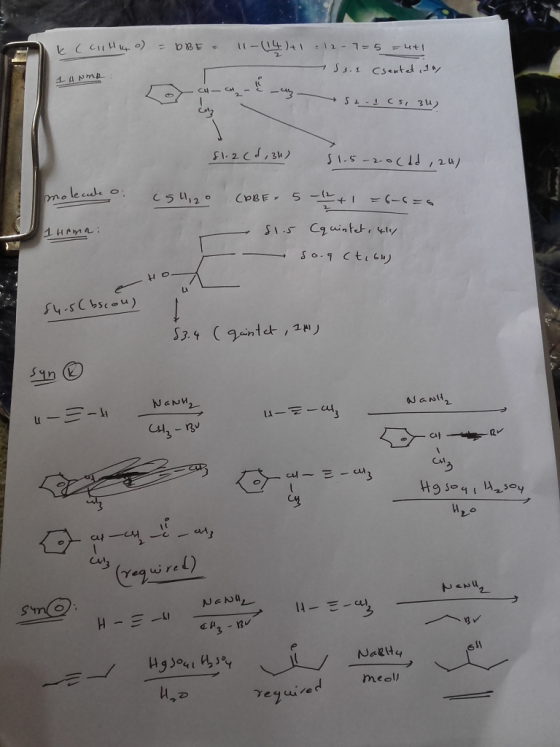
Show the synthesis from acetylene for K (C11 H14 O) and O (C5 H12 O) using the spectra below

Homework Answers
Add Answer to:
Show the synthesis from acetylene for K (C11 H14 O) and O (C5 H12 O) using the spectra below Molecule 1 Molecule O Mol...
Use the spectra below to answer for K and O Show the synthesis of Kt o...
 Use the spectra below to answer for K and O
Show the synthesis of Kt o from acetylene. PAFT I SYNTHESIS син o С, но . Molecule K 5H 2H diastereotopic - 1H PPM Molecule o 6H 4H 1H 1Н exchangeable PPM
Use the spectra below to answer for K and O
Show the synthesis of Kt o from acetylene. PAFT I SYNTHESIS син o С, но . Molecule K 5H 2H diastereotopic - 1H PPM Molecule o 6H 4H 1H 1Н exchangeable PPM
Use the spectra above to determine the reactions and the products of K, and O Answer...
 Use the spectra above to determine the reactions and the
products of K, and O
Answer in the boxes below
Reactions
Products
Syaimin tg Kio fmи аеyene adyene РАРТ Show Yu SprTHEGNS CuHMO CsHO Molecule K ЗН 3H 5H 2H diastereotopic 1н PPM o Molecule O 6H 4H 1H 1H exchangeable PPM K O К O
Use the spectra above to determine the reactions and the
products of K, and O
Answer in the boxes below
Reactions
Products
Syaimin tg Kio fmи аеyene adyene РАРТ Show Yu SprTHEGNS CuHMO CsHO Molecule K ЗН 3H 5H 2H diastereotopic 1н PPM o Molecule O 6H 4H 1H 1H exchangeable PPM K O К O
Use the spectra below to fill in the boxes for the reaction above. If it isn't clear box J is (C11 H24 O) and box I is...
 Use the spectra below to fill in the boxes for the reaction
above.
If it isn't clear box J is (C11 H24 O) and box I is (C9 H10
O)
NARCC H240) NMR (Cq HOO) Molecule 9H Зн 2н 2н PPM Molecule ) 9H ЗН ін 2H 2H Е -
Use the spectra below to fill in the boxes for the reaction
above.
If it isn't clear box J is (C11 H24 O) and box I is (C9 H10
O)
NARCC H240) NMR (Cq HOO) Molecule 9H Зн 2н 2н PPM Molecule ) 9H ЗН ін 2H 2H Е -
Use the spectra below to fill in all the letter spaces in the Guided synthesis Molecule 9H Зн 2н 2н PPM Molecule ) 9H...
 Use the spectra below to fill in all the letter spaces in the
Guided synthesis
Molecule 9H Зн 2н 2н PPM Molecule ) 9H ЗН ін 2H 2H Е - Molecule F IH L6H 2H2H Clotis 1. Imole Hel 1.Li/NH3 -78°c 2. Mc PBA 2. 1 mole HI Kamaryu H NMR/IR VE c) H₂O FNne) (NMR/IR lCq H180 co ter) C10Hz, Br
Use the spectra below to fill in all the letter spaces in the
Guided synthesis
Molecule 9H Зн 2н 2н PPM Molecule ) 9H ЗН ін 2H 2H Е - Molecule F IH L6H 2H2H Clotis 1. Imole Hel 1.Li/NH3 -78°c 2. Mc PBA 2. 1 mole HI Kamaryu H NMR/IR VE c) H₂O FNne) (NMR/IR lCq H180 co ter) C10Hz, Br
Below is the H NMR spectra for the molecule styrene. Consider if a hydroboration reaction was...
 Below is the H NMR spectra for the molecule styrene.
Consider if a hydroboration reaction was preformed on styrene.
How would the H NMR of the expected product change in comparison to
styrene? Circle which peaks from the styrene spectra would
disappear and not be present in the NMR of the product.
Draw the expected product. Describe the splitting pattern of
each new proton signal that would appear in the NMR of the
product.
2) Below is the 'H NMR...
Below is the H NMR spectra for the molecule styrene.
Consider if a hydroboration reaction was preformed on styrene.
How would the H NMR of the expected product change in comparison to
styrene? Circle which peaks from the styrene spectra would
disappear and not be present in the NMR of the product.
Draw the expected product. Describe the splitting pattern of
each new proton signal that would appear in the NMR of the
product.
2) Below is the 'H NMR...
Spectroscopy Unknown. The spectra and data provided were obtained from a pure organic molecule. For 1...
 Spectroscopy Unknown. The spectra and data provided were
obtained from a pure organic molecule. For 1 H NMR Spectra, the
integral is given in number of hydrogens (#H) or as a relative
ratio. Important coupling constants (J-values) are listed next to
the peaks for some examples. For some spectra, an inset (grey box)
is also given showing a “zoom-in” on an important part of the
spectrum.
Mass Spectrum (not shown): [M] = 169 (100%) m/z IR Spectrum (not shown): 2985,...
Spectroscopy Unknown. The spectra and data provided were
obtained from a pure organic molecule. For 1 H NMR Spectra, the
integral is given in number of hydrogens (#H) or as a relative
ratio. Important coupling constants (J-values) are listed next to
the peaks for some examples. For some spectra, an inset (grey box)
is also given showing a “zoom-in” on an important part of the
spectrum.
Mass Spectrum (not shown): [M] = 169 (100%) m/z IR Spectrum (not shown): 2985,...
NEED HELP WITH B) C) D) E) F) and G) that apply to the spectra below....
 NEED HELP WITH B) C) D) E) F) and G) that apply to the
spectra below.
OTHER ANSWERS ARE THERE TO SUPPLEMENT
Thank you!
5. Using the GC mentioned in question 4 and the values listed on
the chromatogram for the height and width (at half height) of each
peak, calculate the percent composition for each product (A, B and
C). Be sure to show your work.
Area of peak A = 125 x 8 =
1000mm2
Area of peak...
NEED HELP WITH B) C) D) E) F) and G) that apply to the
spectra below.
OTHER ANSWERS ARE THERE TO SUPPLEMENT
Thank you!
5. Using the GC mentioned in question 4 and the values listed on
the chromatogram for the height and width (at half height) of each
peak, calculate the percent composition for each product (A, B and
C). Be sure to show your work.
Area of peak A = 125 x 8 =
1000mm2
Area of peak...
Unknown H415 100 50 1000 1S00 2000 3000 BRVENUMBERI 4000 Unknown H415 ЗН 1 H-N 2H,...
 Unknown H415 100 50 1000 1S00 2000 3000 BRVENUMBERI 4000 Unknown H415 ЗН 1 H-N 2H, q 1H, d 5H, m 1H, d 0 1 2 3 6 7 8 10 11 ppm HSP-00-049 Unknown H415 q 140 120 100 200 180 160 ppm CDS-00-726 20 -40 60 80 Relative Intensity 09 Unknown H415 100 MS-NJ-0442 80 20 thmpt 25 50 75 100 125 150 175 m/z Date: Name: Section/Group: Instructor: Report Sheet: Laboratory 14 MS,IR, 13C NMR, and 'H...
 Use the spectra below to answer for K and O
Show the synthesis of Kt o from acetylene. PAFT I SYNTHESIS син o С, но . Molecule K 5H 2H diastereotopic - 1H PPM Molecule o 6H 4H 1H 1Н exchangeable PPM
Use the spectra below to answer for K and O
Show the synthesis of Kt o from acetylene. PAFT I SYNTHESIS син o С, но . Molecule K 5H 2H diastereotopic - 1H PPM Molecule o 6H 4H 1H 1Н exchangeable PPM
 Use the spectra above to determine the reactions and the
products of K, and O
Answer in the boxes below
Reactions
Products
Syaimin tg Kio fmи аеyene adyene РАРТ Show Yu SprTHEGNS CuHMO CsHO Molecule K ЗН 3H 5H 2H diastereotopic 1н PPM o Molecule O 6H 4H 1H 1H exchangeable PPM K O К O
Use the spectra above to determine the reactions and the
products of K, and O
Answer in the boxes below
Reactions
Products
Syaimin tg Kio fmи аеyene adyene РАРТ Show Yu SprTHEGNS CuHMO CsHO Molecule K ЗН 3H 5H 2H diastereotopic 1н PPM o Molecule O 6H 4H 1H 1H exchangeable PPM K O К O
 Use the spectra below to fill in the boxes for the reaction
above.
If it isn't clear box J is (C11 H24 O) and box I is (C9 H10
O)
NARCC H240) NMR (Cq HOO) Molecule 9H Зн 2н 2н PPM Molecule ) 9H ЗН ін 2H 2H Е -
Use the spectra below to fill in the boxes for the reaction
above.
If it isn't clear box J is (C11 H24 O) and box I is (C9 H10
O)
NARCC H240) NMR (Cq HOO) Molecule 9H Зн 2н 2н PPM Molecule ) 9H ЗН ін 2H 2H Е -
 Use the spectra below to fill in all the letter spaces in the
Guided synthesis
Molecule 9H Зн 2н 2н PPM Molecule ) 9H ЗН ін 2H 2H Е - Molecule F IH L6H 2H2H Clotis 1. Imole Hel 1.Li/NH3 -78°c 2. Mc PBA 2. 1 mole HI Kamaryu H NMR/IR VE c) H₂O FNne) (NMR/IR lCq H180 co ter) C10Hz, Br
Use the spectra below to fill in all the letter spaces in the
Guided synthesis
Molecule 9H Зн 2н 2н PPM Molecule ) 9H ЗН ін 2H 2H Е - Molecule F IH L6H 2H2H Clotis 1. Imole Hel 1.Li/NH3 -78°c 2. Mc PBA 2. 1 mole HI Kamaryu H NMR/IR VE c) H₂O FNne) (NMR/IR lCq H180 co ter) C10Hz, Br
 Below is the H NMR spectra for the molecule styrene.
Consider if a hydroboration reaction was preformed on styrene.
How would the H NMR of the expected product change in comparison to
styrene? Circle which peaks from the styrene spectra would
disappear and not be present in the NMR of the product.
Draw the expected product. Describe the splitting pattern of
each new proton signal that would appear in the NMR of the
product.
2) Below is the 'H NMR...
Below is the H NMR spectra for the molecule styrene.
Consider if a hydroboration reaction was preformed on styrene.
How would the H NMR of the expected product change in comparison to
styrene? Circle which peaks from the styrene spectra would
disappear and not be present in the NMR of the product.
Draw the expected product. Describe the splitting pattern of
each new proton signal that would appear in the NMR of the
product.
2) Below is the 'H NMR...
 Spectroscopy Unknown. The spectra and data provided were
obtained from a pure organic molecule. For 1 H NMR Spectra, the
integral is given in number of hydrogens (#H) or as a relative
ratio. Important coupling constants (J-values) are listed next to
the peaks for some examples. For some spectra, an inset (grey box)
is also given showing a “zoom-in” on an important part of the
spectrum.
Mass Spectrum (not shown): [M] = 169 (100%) m/z IR Spectrum (not shown): 2985,...
Spectroscopy Unknown. The spectra and data provided were
obtained from a pure organic molecule. For 1 H NMR Spectra, the
integral is given in number of hydrogens (#H) or as a relative
ratio. Important coupling constants (J-values) are listed next to
the peaks for some examples. For some spectra, an inset (grey box)
is also given showing a “zoom-in” on an important part of the
spectrum.
Mass Spectrum (not shown): [M] = 169 (100%) m/z IR Spectrum (not shown): 2985,...
 NEED HELP WITH B) C) D) E) F) and G) that apply to the
spectra below.
OTHER ANSWERS ARE THERE TO SUPPLEMENT
Thank you!
5. Using the GC mentioned in question 4 and the values listed on
the chromatogram for the height and width (at half height) of each
peak, calculate the percent composition for each product (A, B and
C). Be sure to show your work.
Area of peak A = 125 x 8 =
1000mm2
Area of peak...
NEED HELP WITH B) C) D) E) F) and G) that apply to the
spectra below.
OTHER ANSWERS ARE THERE TO SUPPLEMENT
Thank you!
5. Using the GC mentioned in question 4 and the values listed on
the chromatogram for the height and width (at half height) of each
peak, calculate the percent composition for each product (A, B and
C). Be sure to show your work.
Area of peak A = 125 x 8 =
1000mm2
Area of peak...
 Unknown H415 100 50 1000 1S00 2000 3000 BRVENUMBERI 4000 Unknown H415 ЗН 1 H-N 2H, q 1H, d 5H, m 1H, d 0 1 2 3 6 7 8 10 11 ppm HSP-00-049 Unknown H415 q 140 120 100 200 180 160 ppm CDS-00-726 20 -40 60 80 Relative Intensity 09 Unknown H415 100 MS-NJ-0442 80 20 thmpt 25 50 75 100 125 150 175 m/z Date: Name: Section/Group: Instructor: Report Sheet: Laboratory 14 MS,IR, 13C NMR, and 'H...
Most questions answered within 3 hours.
-
Where is the error in this code sequence?
String s1 = "Hello";
String s2 = "ello";...
asked 11 months ago -
Financial data for Joel de Paris, Inc., for last year
follow:
Joel de Paris, Inc.
Balance...
asked 11 months ago -
Consider this reaction:
Al2(SO4)3 (aq)+ BaCl3
(aq) Al2Cl6 (aq)- +
3BaSO4(s) . What is the...
asked 11 months ago -
Suppose that Savneet is considering increasing her
recent random sample from 20 car rentals to 40...
asked 11 months ago -
Trucks arrive at an unloading terminal at an average rate of 120
per hour.
Trucks arrive...
asked 11 months ago -
Why are methanol and ethanol completely soluble in water while
octanol is not very little soluble....
asked 11 months ago -
A facilities manager at a university reads in a research report
that the mean amount of...
asked 11 months ago -
When the CuSO4 is rehydrated by adding water to the anhydrous
compound, is this an endothermic...
asked 11 months ago -
A ray of sunlight is passing from diamond into crown glass; the
angle of incidence is...
asked 11 months ago -
A block of mass 0.249 kg is placed on top of a light, vertical
spring of...
asked 11 months ago -
how do the kidneys compensate in the presences of acidosis
a) trigger hyperventilate
b) reserve acid...
asked 11 months ago -
Question 501 pts
The rental rate of capital to the firm increases. Which of the
following...
asked 11 months ago