The initial diagram has two panels.The left graph
depicts a perfectly inelastic demand curve. The right graph depicts
a relatively flat sloped demand curve. The initial equilibrium in
each graph is labeled point A. We will impose a $3 per unit tax in
the left graph, and a $4 per unit tax in the right graph.

Make a copy of the graph, then follow the below instructions to draw the graph:
-
1. In the left graph $3 above and parallel to the original supply curve, draw a new supply curve, put a black dot at the new equilibrium and label it as point B.
-
2. Draw a vertical arrow between the two supply curves, and label it as a $3 Tax.
-
3. Shade the rectangle representing the rectangle for the tax burden on the buyer.
-
4 In the right graph $4 above and parallel to the original supply curve, draw a new supply curve, put a black dot at the new equilibrium and label it as point B.
-
5. Draw a vertical arrow between the two supply curves, and label it as a $4 Tax.
-
6. Shade the rectangles representing the rectangle for the tax burden on the buyer, and the seller, respectively.
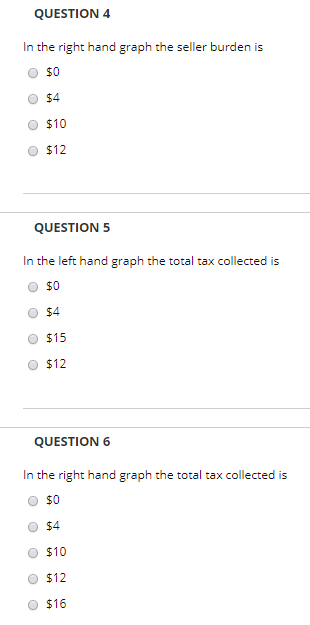

QUESTION 4 In the right hand graph the seller burden is O $0 O $4 O $10 O $12 QUESTION 5 In the left hand graph the total tax collected is O $0 O $4 O $15 O $12 QUESTION 6 In the right hand graph the total tax colected is O $0 O $4 O $10 O $12 O $16
Homework Answers
Answer -4 Correct option is $4.
Producer Burden is 4(3-2) = 4
Answer-5 Correct option is $15
Total tax collected is 5(5-2) = 15
Answer-6 Correct option is $16
Total tax collected is 4(6-2) = 16.

Add Answer to:
The initial diagram has two panels.The left graph depicts a perfectly inelastic demand curve. The right graph depicts a...
The graph to the right depicts the average cost curves and the marginal cost curve for...
 The graph to the right depicts the average cost curves and the marginal cost curve for a typical firm in a competitive industry. 1.) Using the line drawing fool, draw the firm's demand curve at a market price such that the firm is breaking even. Label your curved, 2.) Using the line drawing tool, draw the firm's demand curve at a market price such that the firm is at its shutdown price. Label your curved, Carefully follow the instructions above,...
The graph to the right depicts the relative ntensive flowers and Foreign exports the land intensive...
 The graph to the right depicts the relative ntensive flowers and Foreign exports the land intensive soybeans. The oument world demand and supply curves for flowers. Home currently exports the labor equilibrium in the market occurs at point Eflects of an Export Subsidy Relatve price of fowers Recal that the relaltive quantity of flowers is computed as(, 0.), whle the rlalive price af fowers is computed P/P Suppose that Home creates an export subsidy for flowers .) Using the line...
Question Number 3 please. 1. Assuming the curves on the right are the actual market Demand...
 Question Number 3 please.
1. Assuming the curves on the right are the actual market Demand curve of US buyers and market supply curve for a pint of ale by US producers, determine the following a. The equilibrium price of ale 0.5 b. quantity demanded for ale by buyers = 600.000 potpurday c. quantity supplied of ale by producers 600,000 potpor des 2. Now assume the Government imposes $3/pint tax on the sale of ale and then determine the following...
Question Number 3 please.
1. Assuming the curves on the right are the actual market Demand curve of US buyers and market supply curve for a pint of ale by US producers, determine the following a. The equilibrium price of ale 0.5 b. quantity demanded for ale by buyers = 600.000 potpurday c. quantity supplied of ale by producers 600,000 potpor des 2. Now assume the Government imposes $3/pint tax on the sale of ale and then determine the following...
Draw a graph with two demand curves – one that is fairly elastic (labeled De) and...
Draw a graph with two demand curves – one that is fairly elastic (labeled De) and one that is fairly inelastic (labeled Di). Draw a supply curve and label it S. Suppose this market sees an increase in the price of this good due to the imposition of a tax. Draw the new supply curve and label it S2. Compare the impact in the market of the shift in supply between the elastic demand curve and the inelastic demand curve....
Amonopoly has a constant marginal cost of production of $2 per unit and no foed costs In the figure to the right, l...
 Amonopoly has a constant marginal cost of production of $2 per unit and no foed costs In the figure to the right, let D be demand and MR be marginal revenue ed 1.) Using the line drawing tool, graph the monopoly's marginal cost curve Label this curve 'MC 2) Using the line drawing tool graph the monopoly's average variable cost curve Label this curve 'AVC 3.) Using the line drawing tool graph the monopoly's average cost curve Label this curve...
The graph on the right shows a labor supply and labor demand curve. Illustrate the impact...
 The graph on the right shows a labor supply and labor demand curve. Illustrate the impact of an efficiency wage that pushes the wage to $9 per hour. 1.) Using the point drawing tool, place a point on the graph that illustrates the market-clearing wage and quantity of labor. Label your point Market clearing.' 2.) Using the point drawing tool, place a point on the graph that illustrates the quantity of labor demanded under an efficiency wage that results in...
The graph shows the supply curve of no-name soda. The government has imposed a sales tax...
 The graph shows the supply curve of no-name soda. The government has imposed a sales tax of $2 per case on no-name soda. Price (dollars per case) The sellers of no-name soda end up paying the entire tax. @ O3 Draw and label the demand curve for no-name soda. The more the demand, O A. inelastic; the larger is the amount of the tax paid by sellers O B. elastic; the larger is the amount of the tax paid by...
5. Producer surplus for a group of sellers The following graph shows the supply curve for...
 5. Producer surplus for a group of sellers The following graph shows the supply curve for a group of sellers in the U.S. market for laptops (orange line). Each seller has only one laptop to sell. The market price of a laptop is shown by the black horizontal line at $175. Each rectangle on the graph corresponds to a particular seller in this market: blue (circle symbols) for Kenji, green (triangle symbols) for Lucia, purple (diamond symbols) for Paolo, tan...
Federal funds rate (percent per year) The graph shows the demand curve for bank reserves, RD....
Federal funds rate (percent per year) The graph shows the demand curve for bank reserves, RD. The current quantity of reserves supplied is $20 billion. 7 Draw a point on the curve that shows the federal funds rate when the quantity of reserves supplied is $20 billion. Label it 1 6- 5- t 4 percent a year The Fed wants to set the federal funds rate Draw a supply of reserves curve that achieves the target. Label it Draw a...
The supply curve for a certain industry is given by S(p) = p−3 and demand by...
The supply curve for a certain industry is given by S(p) = p−3 and demand by D(p) = 33 − 3p. 5. A tax is levied at the rate of $2 per unit. What are the new buyer and seller prices, pb, ps, and the new quantity q? Which price changed more? 6. What is the total tax revenue and the producer and consumer surplus under this tax? What is the deadweight loss (DWL)? 7. If the tax doubles from...
 The graph to the right depicts the average cost curves and the marginal cost curve for a typical firm in a competitive industry. 1.) Using the line drawing fool, draw the firm's demand curve at a market price such that the firm is breaking even. Label your curved, 2.) Using the line drawing tool, draw the firm's demand curve at a market price such that the firm is at its shutdown price. Label your curved, Carefully follow the instructions above,...
 The graph to the right depicts the relative ntensive flowers and Foreign exports the land intensive soybeans. The oument world demand and supply curves for flowers. Home currently exports the labor equilibrium in the market occurs at point Eflects of an Export Subsidy Relatve price of fowers Recal that the relaltive quantity of flowers is computed as(, 0.), whle the rlalive price af fowers is computed P/P Suppose that Home creates an export subsidy for flowers .) Using the line...
 Question Number 3 please.
1. Assuming the curves on the right are the actual market Demand curve of US buyers and market supply curve for a pint of ale by US producers, determine the following a. The equilibrium price of ale 0.5 b. quantity demanded for ale by buyers = 600.000 potpurday c. quantity supplied of ale by producers 600,000 potpor des 2. Now assume the Government imposes $3/pint tax on the sale of ale and then determine the following...
Question Number 3 please.
1. Assuming the curves on the right are the actual market Demand curve of US buyers and market supply curve for a pint of ale by US producers, determine the following a. The equilibrium price of ale 0.5 b. quantity demanded for ale by buyers = 600.000 potpurday c. quantity supplied of ale by producers 600,000 potpor des 2. Now assume the Government imposes $3/pint tax on the sale of ale and then determine the following...
 Amonopoly has a constant marginal cost of production of $2 per unit and no foed costs In the figure to the right, let D be demand and MR be marginal revenue ed 1.) Using the line drawing tool, graph the monopoly's marginal cost curve Label this curve 'MC 2) Using the line drawing tool graph the monopoly's average variable cost curve Label this curve 'AVC 3.) Using the line drawing tool graph the monopoly's average cost curve Label this curve...
 The graph on the right shows a labor supply and labor demand curve. Illustrate the impact of an efficiency wage that pushes the wage to $9 per hour. 1.) Using the point drawing tool, place a point on the graph that illustrates the market-clearing wage and quantity of labor. Label your point Market clearing.' 2.) Using the point drawing tool, place a point on the graph that illustrates the quantity of labor demanded under an efficiency wage that results in...
 The graph shows the supply curve of no-name soda. The government has imposed a sales tax of $2 per case on no-name soda. Price (dollars per case) The sellers of no-name soda end up paying the entire tax. @ O3 Draw and label the demand curve for no-name soda. The more the demand, O A. inelastic; the larger is the amount of the tax paid by sellers O B. elastic; the larger is the amount of the tax paid by...
 5. Producer surplus for a group of sellers The following graph shows the supply curve for a group of sellers in the U.S. market for laptops (orange line). Each seller has only one laptop to sell. The market price of a laptop is shown by the black horizontal line at $175. Each rectangle on the graph corresponds to a particular seller in this market: blue (circle symbols) for Kenji, green (triangle symbols) for Lucia, purple (diamond symbols) for Paolo, tan...
Most questions answered within 3 hours.
-
Where is the error in this code sequence?
String s1 = "Hello";
String s2 = "ello";...
asked 10 months ago -
Financial data for Joel de Paris, Inc., for last year
follow:
Joel de Paris, Inc.
Balance...
asked 10 months ago -
Consider this reaction:
Al2(SO4)3 (aq)+ BaCl3
(aq) Al2Cl6 (aq)- +
3BaSO4(s) . What is the...
asked 10 months ago -
Suppose that Savneet is considering increasing her
recent random sample from 20 car rentals to 40...
asked 10 months ago -
Trucks arrive at an unloading terminal at an average rate of 120
per hour.
Trucks arrive...
asked 10 months ago -
Why are methanol and ethanol completely soluble in water while
octanol is not very little soluble....
asked 10 months ago -
A facilities manager at a university reads in a research report
that the mean amount of...
asked 10 months ago -
When the CuSO4 is rehydrated by adding water to the anhydrous
compound, is this an endothermic...
asked 10 months ago -
A ray of sunlight is passing from diamond into crown glass; the
angle of incidence is...
asked 10 months ago -
A block of mass 0.249 kg is placed on top of a light, vertical
spring of...
asked 10 months ago -
how do the kidneys compensate in the presences of acidosis
a) trigger hyperventilate
b) reserve acid...
asked 10 months ago -
Question 501 pts
The rental rate of capital to the firm increases. Which of the
following...
asked 10 months ago