
| Age | Length |
| 1 | 22 |
| 1 | 22 |
| 1 | 23 |
| 1 | 24 |
| 1 | 25 |
| 1 | 25 |
| 1 | 26 |
| 1 | 26 |
| 1 | 27 |
| 1 | 28 |
| 1 | 29 |
| 1 | 29 |
| 1 | 30 |
| 1 | 30 |
| 1 | 30 |
| 1 | 30 |
| 1 | 31 |
| 1 | 31 |
| 1 | 32 |
| 1 | 32 |
| 1 | 33 |
| 1 | 33 |
| 1 | 35 |
| 1 | 35 |
| 1 | 39 |
| 1 | 41 |
| 1 | 42 |
| 1 | 44 |
| 2 | 28 |
| 2 | 29 |
| 2 | 30 |
| 2 | 31 |
| 2 | 32 |
| 2 | 32 |
| 2 | 33 |
| 2 | 34 |
| 2 | 35 |
| 2 | 36 |
| 2 | 38 |
| 2 | 38 |
| 2 | 39 |
| 2 | 39 |
| 2 | 40 |
| 2 | 40 |
| 2 | 41 |
| 2 | 42 |
| 2 | 42 |
| 2 | 42 |
| 2 | 44 |
| 2 | 44 |
| 2 | 45 |
| 2 | 45 |
| 2 | 46 |
| 2 | 48 |
| 2 | 48 |
| 2 | 49 |
| 2 | 50 |
Homework Answers
The first step is to import the excel data into a data frame in R.
For that we make use of the package xlsx.
Before that, we must check the active directory in R by using the code getwd()
It is easier if we place the excel file in this particular location that is returned by the getwd() command.
Now, we load the package by writing the command library("xlsx")
In case we don't have this package, we can install by writing the command install.packages("xlsx") and then write the command library("xlsx") to load the functions in the package.
We import the data by using the read.xlsx function.
The command is: my_data <- read.xlsx("Minnow Age & Length.xlsx",1, header=TRUE)
The arguments are name of the file, sheet number having the data, and TRUE since the first row is the names of the columns (i.e. Age and Length). You can write the command my_data and press enter to print the contents of the data frame and whether or not the import is correct or not.
--------------------------------------------------------------------------------------------------------------------------
Next, we split this data frame into 2 data frames, one for Age 1 and one for Age 2.
The commands are: my_data1 <- subset(my_data,Age==1)
my_data2 <- subset(my_data,Age==2)
Next job is to create the histogram, for which we can use the hist function.
The command is:
hist(my_data1$Length,main="Lengths of Age group 1",xlab="Frequency",ylab="Length",col="Red")
Only hist(my_data1$Length) will work as well but the above adds Title, x and y labels and the Red color to the histogram.
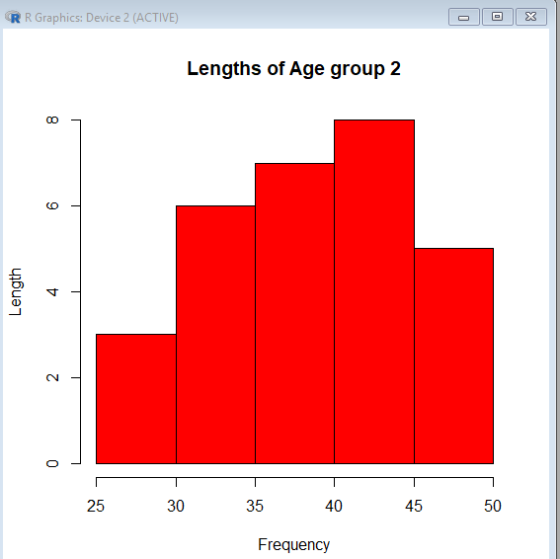
Same command for age group 2 except use the other data frame.
hist(my_data2$Length,main="Lengths of Age group 2",xlab="Frequency",ylab="Length",col="Red")
--------------------------------------------------------------------------------------------------------------------------
The histograms look like:

--------------------------------------------------------------------------------------------------------------------------
The following shows the commands so far:

--------------------------------------------------------------------------------------------------------------------------
Kindly comment in case of any additional clarifications needed. Thanks :)
Add Answer to:
Age Length 1 22 1 22 1 23 1 24 1 25 1 25 1 26 1 26 1 27 1 28 1 29 1 29 1 30 1 30 1 30...
Do the Academy Awards involve discrimination based on age? Listed below are the ages of actresses...
Do the Academy Awards involve discrimination based on age? Listed below are the ages of actresses and actors at the times that they won Oscars in the Best Actress and Best Actor categories. the ages are listed in order, beginning with the first Academy Awards ceremony in 1928. (Note: in 1968 there was a tie in the Best Actress category, and the mean of the two ages is used; in 1932 there was a tie in the Best Actor category,...
Define the following: 26. Audiogram 27. Substernal 28. Osteotomy 29. Vertigo 30. Otalgia 31. Stapedectomy 32....
 Define the following: 26. Audiogram 27. Substernal 28. Osteotomy 29. Vertigo 30. Otalgia 31. Stapedectomy 32. Clavicular 33. Osteitis Supply the defined word: 34. Excision of the intervertebral disk 35. Referring to above the shoulder blade 36. Inflammation of many muscles 37. Changes in hearing that occur with age, 38. Incision into the eardrum 39. Referring to hearing 40. Motion of turning the palm upward 41. Abnormal condition of stiffening Correct any spelling errors: 42. Otoeskope 43. Ostioklast 44. Innverrzion...
The tollowing data represents the age of 30 lottery winners. 20 26 26 27 30 31...
 The tollowing data represents the age of 30 lottery winners. 20 26 26 27 30 31 31 32 34 35 35 36 37 39 42 42 44 45 50 51 52 58 58 60 63 66 68 73 75 81 Complete the frequency distribution for the data. Age Frequency 20-29 30-39 40-49 50-59 60-69 70-79 80-89 Points poss ble 2 This is attemp: 1 of 5
This Question: 1 pt 24 of 24 (6 complete) This Test: 24 pts The following data...
 This Question: 1 pt 24 of 24 (6 complete) This Test: 24 pts The following data show the ages of recent award-winning male actors at the time when they won their award. Make a frequency table for the data, using bins of 20-29, 30-39, and so on. Click the icon to view the ages of male actors. Complete the table below. Age No. of actors 20-29 30-39 40-49 50-59 60-69 Data Table ODDODD 70-79 33 43 44 31 25 31...
These are my instructions: Your data should have been read in from the data file and stored into ...
These are my instructions: Your data should have been read in from the data file and stored into an array. Next you need to calculate the following and display in a single Message box: Average score Highest score Lowest score Mode of the scores Your program should be written using methods and should be well documented internally and externally. Your output should be displayed using Message boxes. This is the .text file to use with the instructions: 20 21 22...
The following data represents the age of 30 lottery winners. 24 26 27 28 28 29...
The following data represents the age of 30 lottery winners. 24 26 27 28 28 29 34 41 41 43 46 47 49 50 51 55 56 56 57 59 61 62 63 70 72 74 78 78 79 81 Complete the frequency distribution for the data. Age Frequency 20-29 30-39 40-49 50-59 60-69 70-79 80-89
The following data represents the age of 30 lottery winners. 20 31 33 33 34 35...
The following data represents the age of 30 lottery winners. 20 31 33 33 34 35 35 39 41 42 44 47 48 49 52 52 53 53 56 58 59 60 61 61 63 63 63 70 72 86 Complete the frequency distribution for the data. Age Frequency 20-29 30-39 40-49 50-59 60-69 70-79 80-89
Refer to the accompanying data set and use the 30 screw lengths to construct a frequency...
 Refer to the accompanying data set and use the 30 screw
lengths to construct a frequency distribution. Begin with a lower
class limit of
2.220
2.220 in., and use a class width of 0.010 in. The screws were
labeled as having a length of
2 1 divided by 4 in.
2 1/4 in.
The following data show the ages of recent award-winning male
actors at the time when they won their award. Make a frequency
table for the data, using...
Refer to the accompanying data set and use the 30 screw
lengths to construct a frequency distribution. Begin with a lower
class limit of
2.220
2.220 in., and use a class width of 0.010 in. The screws were
labeled as having a length of
2 1 divided by 4 in.
2 1/4 in.
The following data show the ages of recent award-winning male
actors at the time when they won their award. Make a frequency
table for the data, using...
Inferences from Two Samples chapter Listed below are the ages of actresses the awards ceremony, b...
 Inferences from Two Samples chapter Listed below are the ages of actresses the awards ceremony, but the ages in and actors at the times that they won the table below are based on the birth Oscars for the categories of Best Actress date of the winner and the date of the and Best Actor. The ages aze listed in awards certmony) chronological otder by row, so that cor- responding locations in the two tables Analyzing the Results are from the...
24 26 30 28 29 28 29 25 30 26 29 27 32 28 28 27...
 24 26 30 28 29 28 29 25 30 26 29 27 32 28 28 27 27 26 25 29 2730 28 27 29 31 27 28 25. Use a stalistical calculator with the data values in exercise 18 to find b. Population standard deviation, assuming x-μ c. Sample standard deviation d.σ2 e. 29. Use the results from exercise 25 to find the following values for the data in exercise 18: What percentage of the data values in exercise 18...
 Define the following: 26. Audiogram 27. Substernal 28. Osteotomy 29. Vertigo 30. Otalgia 31. Stapedectomy 32. Clavicular 33. Osteitis Supply the defined word: 34. Excision of the intervertebral disk 35. Referring to above the shoulder blade 36. Inflammation of many muscles 37. Changes in hearing that occur with age, 38. Incision into the eardrum 39. Referring to hearing 40. Motion of turning the palm upward 41. Abnormal condition of stiffening Correct any spelling errors: 42. Otoeskope 43. Ostioklast 44. Innverrzion...
 The tollowing data represents the age of 30 lottery winners. 20 26 26 27 30 31 31 32 34 35 35 36 37 39 42 42 44 45 50 51 52 58 58 60 63 66 68 73 75 81 Complete the frequency distribution for the data. Age Frequency 20-29 30-39 40-49 50-59 60-69 70-79 80-89 Points poss ble 2 This is attemp: 1 of 5
 This Question: 1 pt 24 of 24 (6 complete) This Test: 24 pts The following data show the ages of recent award-winning male actors at the time when they won their award. Make a frequency table for the data, using bins of 20-29, 30-39, and so on. Click the icon to view the ages of male actors. Complete the table below. Age No. of actors 20-29 30-39 40-49 50-59 60-69 Data Table ODDODD 70-79 33 43 44 31 25 31...
 Refer to the accompanying data set and use the 30 screw
lengths to construct a frequency distribution. Begin with a lower
class limit of
2.220
2.220 in., and use a class width of 0.010 in. The screws were
labeled as having a length of
2 1 divided by 4 in.
2 1/4 in.
The following data show the ages of recent award-winning male
actors at the time when they won their award. Make a frequency
table for the data, using...
Refer to the accompanying data set and use the 30 screw
lengths to construct a frequency distribution. Begin with a lower
class limit of
2.220
2.220 in., and use a class width of 0.010 in. The screws were
labeled as having a length of
2 1 divided by 4 in.
2 1/4 in.
The following data show the ages of recent award-winning male
actors at the time when they won their award. Make a frequency
table for the data, using...
 Inferences from Two Samples chapter Listed below are the ages of actresses the awards ceremony, but the ages in and actors at the times that they won the table below are based on the birth Oscars for the categories of Best Actress date of the winner and the date of the and Best Actor. The ages aze listed in awards certmony) chronological otder by row, so that cor- responding locations in the two tables Analyzing the Results are from the...
 24 26 30 28 29 28 29 25 30 26 29 27 32 28 28 27 27 26 25 29 2730 28 27 29 31 27 28 25. Use a stalistical calculator with the data values in exercise 18 to find b. Population standard deviation, assuming x-μ c. Sample standard deviation d.σ2 e. 29. Use the results from exercise 25 to find the following values for the data in exercise 18: What percentage of the data values in exercise 18...
Most questions answered within 3 hours.
-
Where is the error in this code sequence?
String s1 = "Hello";
String s2 = "ello";...
asked 11 months ago -
Financial data for Joel de Paris, Inc., for last year
follow:
Joel de Paris, Inc.
Balance...
asked 11 months ago -
Consider this reaction:
Al2(SO4)3 (aq)+ BaCl3
(aq) Al2Cl6 (aq)- +
3BaSO4(s) . What is the...
asked 11 months ago -
Suppose that Savneet is considering increasing her
recent random sample from 20 car rentals to 40...
asked 11 months ago -
Trucks arrive at an unloading terminal at an average rate of 120
per hour.
Trucks arrive...
asked 11 months ago -
Why are methanol and ethanol completely soluble in water while
octanol is not very little soluble....
asked 11 months ago -
A facilities manager at a university reads in a research report
that the mean amount of...
asked 11 months ago -
When the CuSO4 is rehydrated by adding water to the anhydrous
compound, is this an endothermic...
asked 11 months ago -
A ray of sunlight is passing from diamond into crown glass; the
angle of incidence is...
asked 11 months ago -
A block of mass 0.249 kg is placed on top of a light, vertical
spring of...
asked 11 months ago -
how do the kidneys compensate in the presences of acidosis
a) trigger hyperventilate
b) reserve acid...
asked 11 months ago -
Question 501 pts
The rental rate of capital to the firm increases. Which of the
following...
asked 11 months ago