
Homework Answers
syms k
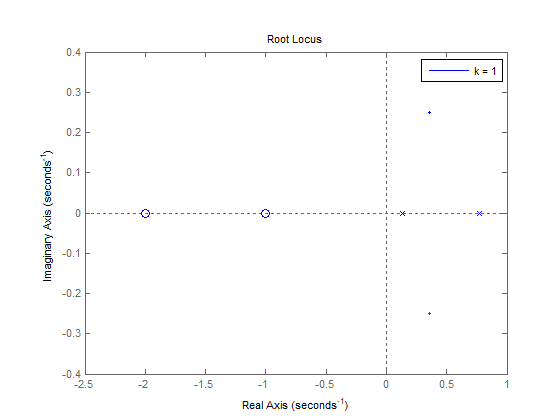
k = 1;
numerator = [0.5,1.5,1];
denominator = [10,-9,1];
sys = tf(numerator,denominator)
sys =
0.5 s^2 + 1.5 s + 1
-------------------
10 s^2 - 9 s + 1
bode(sys)

nyquist(sys)

rlocus(sys,k)
Add Answer to:
please solve the (a) (b) (d) 6.19 Sketch the Nyquist plot based on the Bode plots for each of the following systems, an...
please use matlab etch the Nyquist plot based on the Bode plots for each of the following systems, and then compa...
 please use matlab
etch the Nyquist plot based on the Bode plots for each of the following systems, and then compare your result with that obtained by using the Matlab command nyquist: Don't be concerned with the details of exactly where the curve goes, but do make sure it crosses the real axis at the right spot, has the correct number of -1 encirclements, and goes off to infinity in the correct direction. 6.19 Sk K(0.5 (a) GH(s) K (4s+1)...
please use matlab
etch the Nyquist plot based on the Bode plots for each of the following systems, and then compare your result with that obtained by using the Matlab command nyquist: Don't be concerned with the details of exactly where the curve goes, but do make sure it crosses the real axis at the right spot, has the correct number of -1 encirclements, and goes off to infinity in the correct direction. 6.19 Sk K(0.5 (a) GH(s) K (4s+1)...
Problem 3: Use method 2 (no Bode plots) to sketch the Nyquist plot for: (s –...
 Problem 3: Use method 2 (no Bode plots) to sketch the Nyquist plot for: (s – 10) P(S) = (s + 5)(s +1) You may assume the frequency response for P(s) is monotonic.
Sketch the Nyquist plots of the following loop transfer functions L(S) = Gc(s)G(s), and determine whether...
 Sketch the Nyquist plots of the following loop transfer functions L(S) = Gc(s)G(s), and determine whether the system is stable by applying the Nyquist criterion: KS + 1) (b) L(s) = G (9)G(s) = 318+) If the system is stable, find the maximum value for K by determining the point where the Nyquist plot crosses the u-axis.
Bode Plots Sketch the Bode plot magnitude and phase for each of the three open-loop transfer...
Bode Plots Sketch the Bode plot magnitude and phase for each of the three open-loop transfer functions listed below. Verify your results using the bode m function in MATLAB.(a) \(G(s)=\frac{100}{s(0.1 s+1)(0.01 s+1)}\)(b) \(G(s)=\frac{1}{(s+1)^{2}\left(s^{2}+s+9\right)}\)(c) \(G(s)=\frac{16000 s}{(s+1)(s+100)\left(s^{2}+5 s+1600\right)}\)
6. Sketch Bode log magnitude plot for the following transfer functions manually. Then use Matlab's "bode"...
 6. Sketch Bode log magnitude plot for the following transfer functions manually. Then use Matlab's "bode" command to plot the same and compare it with your manually obtained sketches. (s + 10) (s + 200) a) X(s) = TS + 20)-(s +1000) b) X(S) = TS + 1)(52 + 4s + 16)
For the given system (s+25) P(s) s(s+1)(s+3000) 1. Sketch, by hand, the Bode asymptote plots for phase and magnitude. S...
 For the given system (s+25) P(s) s(s+1)(s+3000) 1. Sketch, by hand, the Bode asymptote plots for phase and magnitude. Show all your work 2. Sketch by hand the Nyquist plot of the system 3. What is the system's upward, downward gain margins?
For the given system (s+25) P(s) s(s+1)(s+3000) 1. Sketch, by hand, the Bode asymptote plots for phase and magnitude. Show all your work 2. Sketch by hand the Nyquist plot of the system 3. What is the system's...
For the given system (s+25) P(s) s(s+1)(s+3000) 1. Sketch, by hand, the Bode asymptote plots for phase and magnitude. Show all your work 2. Sketch by hand the Nyquist plot of the system 3. What is the system's upward, downward gain margins?
For the given system (s+25) P(s) s(s+1)(s+3000) 1. Sketch, by hand, the Bode asymptote plots for phase and magnitude. Show all your work 2. Sketch by hand the Nyquist plot of the system 3. What is the system's...
Q1. Draw the bode plot for each of the following systems. Compare your sketches with the plots obtained using the 'bode' command in MATLAB. a) Gs)4000 (s +40) e Gs) 1005+4) s(s+Is 25+5)...
 Q1. Draw the bode plot for each of the following systems. Compare your sketches with the plots obtained using the 'bode' command in MATLAB. a) Gs)4000 (s +40) e Gs) 1005+4) s(s+Is 25+5)
Q1. Draw the bode plot for each of the following systems. Compare your sketches with the plots obtained using the 'bode' command in MATLAB. a) Gs)4000 (s +40) e Gs) 1005+4) s(s+Is 25+5)
Q1. Draw the bode plot for each of the following systems. Compare your sketches with the plots obtained using the 'bode' command in MATLAB. a) Gs)4000 (s +40) e Gs) 1005+4) s(s+Is 25+5)
Please plot on semi-log scale for both magnitude and phase separately B. Sketch the Bode plots...
 Please plot on semi-log scale for both magnitude and phase
separately
B. Sketch the Bode plots for the magnitude and the phase for the transfer function: 10(S + 1) H(S) = S(S + 10)(8 + 100)
Please plot on semi-log scale for both magnitude and phase
separately
B. Sketch the Bode plots for the magnitude and the phase for the transfer function: 10(S + 1) H(S) = S(S + 10)(8 + 100)
16.1 For the following systems, sketch the Bode diagram, and from the straight-line approximations to the...
 16.1 For the following systems, sketch the Bode diagram, and from the straight-line approximations to the gain and phase plots, estimate the maximum value of K for which the system is stable: a. GH(s) = s(s + 1) (s + 4) b. GH(s) = = s(1 + s) KS c. GH() = 6 *21 к d. GH(s) = s(s? + 2s + 16) 5K(1 + s) e. GH(S) = f'( + s/352
I got A,B,C done can you do D,E,F Also can you check my solutions please. Thank...
 I got A,B,C done can you do D,E,F
Also can you check my solutions please. Thank you ?
Question 1 - Consider an unit feedback system whose open-loop transfer function is G(s)-k/ ((s + 1)(s 2 +4s 25)) A. Draw Bode plot of the open-loop system for k-75 B. Calculate the phase and magnitude of G(s) at 1 rad/s for k 75 C. Determine the cross-over frequency, and the phase and gain margins for k-75 (14 marks D. What is...
I got A,B,C done can you do D,E,F
Also can you check my solutions please. Thank you ?
Question 1 - Consider an unit feedback system whose open-loop transfer function is G(s)-k/ ((s + 1)(s 2 +4s 25)) A. Draw Bode plot of the open-loop system for k-75 B. Calculate the phase and magnitude of G(s) at 1 rad/s for k 75 C. Determine the cross-over frequency, and the phase and gain margins for k-75 (14 marks D. What is...
 please use matlab
etch the Nyquist plot based on the Bode plots for each of the following systems, and then compare your result with that obtained by using the Matlab command nyquist: Don't be concerned with the details of exactly where the curve goes, but do make sure it crosses the real axis at the right spot, has the correct number of -1 encirclements, and goes off to infinity in the correct direction. 6.19 Sk K(0.5 (a) GH(s) K (4s+1)...
please use matlab
etch the Nyquist plot based on the Bode plots for each of the following systems, and then compare your result with that obtained by using the Matlab command nyquist: Don't be concerned with the details of exactly where the curve goes, but do make sure it crosses the real axis at the right spot, has the correct number of -1 encirclements, and goes off to infinity in the correct direction. 6.19 Sk K(0.5 (a) GH(s) K (4s+1)...
 Problem 3: Use method 2 (no Bode plots) to sketch the Nyquist plot for: (s – 10) P(S) = (s + 5)(s +1) You may assume the frequency response for P(s) is monotonic.
 Sketch the Nyquist plots of the following loop transfer functions L(S) = Gc(s)G(s), and determine whether the system is stable by applying the Nyquist criterion: KS + 1) (b) L(s) = G (9)G(s) = 318+) If the system is stable, find the maximum value for K by determining the point where the Nyquist plot crosses the u-axis.
 6. Sketch Bode log magnitude plot for the following transfer functions manually. Then use Matlab's "bode" command to plot the same and compare it with your manually obtained sketches. (s + 10) (s + 200) a) X(s) = TS + 20)-(s +1000) b) X(S) = TS + 1)(52 + 4s + 16)
 For the given system (s+25) P(s) s(s+1)(s+3000) 1. Sketch, by hand, the Bode asymptote plots for phase and magnitude. Show all your work 2. Sketch by hand the Nyquist plot of the system 3. What is the system's upward, downward gain margins?
For the given system (s+25) P(s) s(s+1)(s+3000) 1. Sketch, by hand, the Bode asymptote plots for phase and magnitude. Show all your work 2. Sketch by hand the Nyquist plot of the system 3. What is the system's...
For the given system (s+25) P(s) s(s+1)(s+3000) 1. Sketch, by hand, the Bode asymptote plots for phase and magnitude. Show all your work 2. Sketch by hand the Nyquist plot of the system 3. What is the system's upward, downward gain margins?
For the given system (s+25) P(s) s(s+1)(s+3000) 1. Sketch, by hand, the Bode asymptote plots for phase and magnitude. Show all your work 2. Sketch by hand the Nyquist plot of the system 3. What is the system's...
 Q1. Draw the bode plot for each of the following systems. Compare your sketches with the plots obtained using the 'bode' command in MATLAB. a) Gs)4000 (s +40) e Gs) 1005+4) s(s+Is 25+5)
Q1. Draw the bode plot for each of the following systems. Compare your sketches with the plots obtained using the 'bode' command in MATLAB. a) Gs)4000 (s +40) e Gs) 1005+4) s(s+Is 25+5)
Q1. Draw the bode plot for each of the following systems. Compare your sketches with the plots obtained using the 'bode' command in MATLAB. a) Gs)4000 (s +40) e Gs) 1005+4) s(s+Is 25+5)
 Please plot on semi-log scale for both magnitude and phase
separately
B. Sketch the Bode plots for the magnitude and the phase for the transfer function: 10(S + 1) H(S) = S(S + 10)(8 + 100)
Please plot on semi-log scale for both magnitude and phase
separately
B. Sketch the Bode plots for the magnitude and the phase for the transfer function: 10(S + 1) H(S) = S(S + 10)(8 + 100)
 16.1 For the following systems, sketch the Bode diagram, and from the straight-line approximations to the gain and phase plots, estimate the maximum value of K for which the system is stable: a. GH(s) = s(s + 1) (s + 4) b. GH(s) = = s(1 + s) KS c. GH() = 6 *21 к d. GH(s) = s(s? + 2s + 16) 5K(1 + s) e. GH(S) = f'( + s/352
 I got A,B,C done can you do D,E,F
Also can you check my solutions please. Thank you ?
Question 1 - Consider an unit feedback system whose open-loop transfer function is G(s)-k/ ((s + 1)(s 2 +4s 25)) A. Draw Bode plot of the open-loop system for k-75 B. Calculate the phase and magnitude of G(s) at 1 rad/s for k 75 C. Determine the cross-over frequency, and the phase and gain margins for k-75 (14 marks D. What is...
I got A,B,C done can you do D,E,F
Also can you check my solutions please. Thank you ?
Question 1 - Consider an unit feedback system whose open-loop transfer function is G(s)-k/ ((s + 1)(s 2 +4s 25)) A. Draw Bode plot of the open-loop system for k-75 B. Calculate the phase and magnitude of G(s) at 1 rad/s for k 75 C. Determine the cross-over frequency, and the phase and gain margins for k-75 (14 marks D. What is...
Most questions answered within 3 hours.
-
Where is the error in this code sequence?
String s1 = "Hello";
String s2 = "ello";...
asked 10 months ago -
Financial data for Joel de Paris, Inc., for last year
follow:
Joel de Paris, Inc.
Balance...
asked 10 months ago -
Consider this reaction:
Al2(SO4)3 (aq)+ BaCl3
(aq) Al2Cl6 (aq)- +
3BaSO4(s) . What is the...
asked 10 months ago -
Suppose that Savneet is considering increasing her
recent random sample from 20 car rentals to 40...
asked 10 months ago -
Trucks arrive at an unloading terminal at an average rate of 120
per hour.
Trucks arrive...
asked 10 months ago -
Why are methanol and ethanol completely soluble in water while
octanol is not very little soluble....
asked 10 months ago -
A facilities manager at a university reads in a research report
that the mean amount of...
asked 10 months ago -
When the CuSO4 is rehydrated by adding water to the anhydrous
compound, is this an endothermic...
asked 10 months ago -
A ray of sunlight is passing from diamond into crown glass; the
angle of incidence is...
asked 10 months ago -
A block of mass 0.249 kg is placed on top of a light, vertical
spring of...
asked 10 months ago -
how do the kidneys compensate in the presences of acidosis
a) trigger hyperventilate
b) reserve acid...
asked 10 months ago -
Question 501 pts
The rental rate of capital to the firm increases. Which of the
following...
asked 10 months ago