A.


B.

2. The test statistic,is ______
(Round to two decimal places as needed.)
3. The P-value is ______
(Round to three decimal places as needed.)
4. State the conclusion for the test.
________________ the null hypothesis. There ______ sufficient evidence to support the claim that those treated with magnets have a greater mean reduction in pain than those given a sham treatment.
5. Is it valid to argue that magnets might appear to be effective if the sample sizes are larger?
Since the ___________ for those treated with magnets is _________ the sample mean for those given a sham treatment, it ___________ valid to argue that magnets might appear to be effective if the sample sizes are larger.
b. Construct a confidence interval suitable for testing the claim that those treated with magnets have a greater mean reduction in pain than those given a sham treatment.
____< μ1−μ2 < ______
(Round to three decimal places as needed.)
C.


D.


P.S Can you please answer part A-D. I am very sick and I can't think right now. Please help me im begging you. My assignment is due tonight and Ive been stuck in bed all week. Please help. May god bless your soul!
Homework Answers
9.2.6) a)
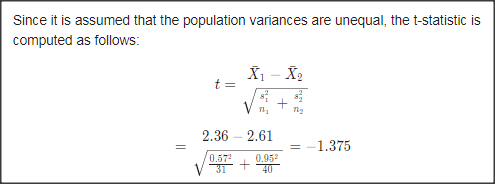
Answer: t = -1.38
P-value = 0.174
Correct answer: Option (A)
b)

9.2.9) a)
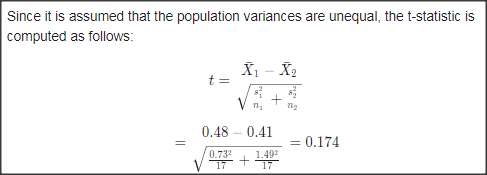
Correct answer: t = 0.17
P-value : p = 0.432
We accept the null hypothesis. There is no sufficient evidence to support the claim that those treated with magnets have a greater mean reduction in pain than those given a sham treatment.
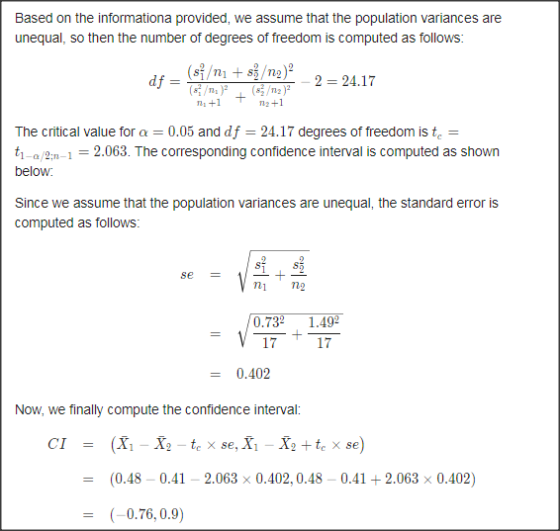
b)
Add Answer to:
A. B. 2. The test statistic,is ______ (Round to two decimal places as needed.) 3. The P-value is ______ (Round t...
A. B. 2. Identify the test statistic. (Round to two decimal places as needed.) 3. Use...
 A.
B.
2. Identify the test statistic. (Round to two decimal places as
needed.)
3. Use technology to identify the P-value. (Round to three
decimal places as needed.)
4. What is the conclusion for this hypothesis test?
A. Fail to reject H 0. There is insufficient evidence to support
the claim that the treatment group has errors that vary
significantly more than the errors of the placebo group.
B. Reject H 0. There is insufficient evidence to support the claim...
A.
B.
2. Identify the test statistic. (Round to two decimal places as
needed.)
3. Use technology to identify the P-value. (Round to three
decimal places as needed.)
4. What is the conclusion for this hypothesis test?
A. Fail to reject H 0. There is insufficient evidence to support
the claim that the treatment group has errors that vary
significantly more than the errors of the placebo group.
B. Reject H 0. There is insufficient evidence to support the claim...
A. B. C. D. Construct a confidence interval suitable for testing claim that students taking non...
 A.
B.
C.
D.
Construct a confidence interval suitable for testing claim that
students taking non proctored tests get higher mean score than
those taking proctored tests.
___<µ1 - µ2 < ____
Yes/No____ because the confidence interval contains only
positive values/only negative values/zero ______.
E.
Construct a confidence interval suitable for testing claim that
students taking non proctored tests get higher mean score than
those taking proctored tests.
___<µ1 - µ2 < ____
Yes/No____ because the confidence interval contains only...
A.
B.
C.
D.
Construct a confidence interval suitable for testing claim that
students taking non proctored tests get higher mean score than
those taking proctored tests.
___<µ1 - µ2 < ____
Yes/No____ because the confidence interval contains only
positive values/only negative values/zero ______.
E.
Construct a confidence interval suitable for testing claim that
students taking non proctored tests get higher mean score than
those taking proctored tests.
___<µ1 - µ2 < ____
Yes/No____ because the confidence interval contains only...
Given in the table are the BMI statistics for random samples of men and women. Assume...
 Given in the table are the BMI statistics for random samples of men and women. Assume that the two samples are independent simple random samples selected from normally distributed populations, and do not assume that the population standard deviations are equal. Complete parts (a) and (b) below. Use a 0.05 significance level for both parts. n Male BMI Female BMI 1 12 50 50 27.5997 25 6435 8.819325 4.764227 X S a. Test the claim that males and females have...
I just need Help with part B please A study was done using a treatment group...
 I just need Help with part B please
A study was done using a treatment group and a placebo group. The results are shown in the table. Assume that the two samples are independent simple random samples selected from normally distributed populations, and do not assume that the population standard deviations are equal. Complete parts (a) and n (b) below. Use a 0.01 significance level for both parts. X Treatment Placebo 11 HE 27 31 2.38 2.62 0.89 0.62 HH,...
I just need Help with part B please
A study was done using a treatment group and a placebo group. The results are shown in the table. Assume that the two samples are independent simple random samples selected from normally distributed populations, and do not assume that the population standard deviations are equal. Complete parts (a) and n (b) below. Use a 0.01 significance level for both parts. X Treatment Placebo 11 HE 27 31 2.38 2.62 0.89 0.62 HH,...
V2 Given in the table are the BMI statistics for random samples of men and women....
 V2 Given in the table are the BMI statistics for random samples of men and women. Assume that the two samples are independent simple random samples selected from normally distributed populations, and do not assume that the population standard deviations are equal. Complete parts (a) and (b) below. Use a 0.05 significance level for both parts. P1 40 28.4029 7.020534 X 40 24.8792 4.562776 5 OC. Hoy H2 HH1 H2 D. Ho: 11 12 на: 4 #2 The test statistic,...
9.2.01 Treatment Placebo group and from norruse 0.055 A study was done using a treatment group...
 9.2.01 Treatment Placebo group and from norruse 0.055 A study was done using a treatment group and a placebo group. The results are shown in the table. Assume that the two samples are independent simple random samples selected from normally distributed populations, and do not assume that the population standard deviations are equal. Complete parts (a) and (b) below. Use a 0.05 significance level for both parts. n x 25 2.31 0.66 2.61 0.92 O C. Ho: H1 H2 Hy:...
A study was done using a treatment group and a placebo group. The results are shown...
 A study was done using a treatment group and a placebo group. The results are shown in the table. Assume that the two samples are independent simple random samples selected from normally distributed populations, and do not assume that the population standard deviations are equal. Complete parts (a) and (b) below. Use a 0.10 significance level for both parts. n Treatment Placebo H2 34 40 2.39 2.62 0.56 0.85 X S UU. 110 H1 H2 H:H1 H2 UU. 110-11-12 HH1...
Treatment Placebo A study was done using a treatment group and a placebo group. The results...
 Treatment Placebo A study was done using a treatment group and a placebo group. The results are shown in the table. Assume that the two samples are independent simple random samples selected from normally distributed populations, and do not assume that Hy the population standard deviations are equal. Complete parts (a) and (b) below. Use a 0.06 significance level for both parts. In 35 3a x 2.32 2.69 5 0 . 0.56 a. Test the claim that the two samples...
1. Identify the test statistic. Z=_____(Round to two decimal places as needed.) Identify the P-value. P=_____(Round...
 1.
Identify the test
statistic.
Z=_____(Round to two decimal places as needed.)
Identify the P-value.
P=_____(Round to three decimal places as needed.)
What is the conclusion based on the hypothesis test?
The P-value is (1)_____ the significance level of α=0.05, so
(2)_____ the null hypothesis. There (3)_____ evidence to warrant
rejection of the claim that women and men have equal success in
challenging calls.
b. Test the claim by constructing an appropriate confidence
interval.
The 95% or 99% confidence interval...
1.
Identify the test
statistic.
Z=_____(Round to two decimal places as needed.)
Identify the P-value.
P=_____(Round to three decimal places as needed.)
What is the conclusion based on the hypothesis test?
The P-value is (1)_____ the significance level of α=0.05, so
(2)_____ the null hypothesis. There (3)_____ evidence to warrant
rejection of the claim that women and men have equal success in
challenging calls.
b. Test the claim by constructing an appropriate confidence
interval.
The 95% or 99% confidence interval...
A study was done using a treatment group and a placebo group. The results are shown...
 A study was done using a treatment group and a placebo group. The results are shown in the table. Assume that the two samples are independent simple random samples selected from nom assume that the population standard deviations are equal. Complete all parts below. Use a 0.05 significance level Test the claim that the two samples are from populations with the same mean. What are the null and alternative hypotheses? O A. Ho: *12 H₂ H <H2 C. Hos H,...
 A.
B.
2. Identify the test statistic. (Round to two decimal places as
needed.)
3. Use technology to identify the P-value. (Round to three
decimal places as needed.)
4. What is the conclusion for this hypothesis test?
A. Fail to reject H 0. There is insufficient evidence to support
the claim that the treatment group has errors that vary
significantly more than the errors of the placebo group.
B. Reject H 0. There is insufficient evidence to support the claim...
A.
B.
2. Identify the test statistic. (Round to two decimal places as
needed.)
3. Use technology to identify the P-value. (Round to three
decimal places as needed.)
4. What is the conclusion for this hypothesis test?
A. Fail to reject H 0. There is insufficient evidence to support
the claim that the treatment group has errors that vary
significantly more than the errors of the placebo group.
B. Reject H 0. There is insufficient evidence to support the claim...
 A.
B.
C.
D.
Construct a confidence interval suitable for testing claim that
students taking non proctored tests get higher mean score than
those taking proctored tests.
___<µ1 - µ2 < ____
Yes/No____ because the confidence interval contains only
positive values/only negative values/zero ______.
E.
Construct a confidence interval suitable for testing claim that
students taking non proctored tests get higher mean score than
those taking proctored tests.
___<µ1 - µ2 < ____
Yes/No____ because the confidence interval contains only...
A.
B.
C.
D.
Construct a confidence interval suitable for testing claim that
students taking non proctored tests get higher mean score than
those taking proctored tests.
___<µ1 - µ2 < ____
Yes/No____ because the confidence interval contains only
positive values/only negative values/zero ______.
E.
Construct a confidence interval suitable for testing claim that
students taking non proctored tests get higher mean score than
those taking proctored tests.
___<µ1 - µ2 < ____
Yes/No____ because the confidence interval contains only...
 Given in the table are the BMI statistics for random samples of men and women. Assume that the two samples are independent simple random samples selected from normally distributed populations, and do not assume that the population standard deviations are equal. Complete parts (a) and (b) below. Use a 0.05 significance level for both parts. n Male BMI Female BMI 1 12 50 50 27.5997 25 6435 8.819325 4.764227 X S a. Test the claim that males and females have...
 I just need Help with part B please
A study was done using a treatment group and a placebo group. The results are shown in the table. Assume that the two samples are independent simple random samples selected from normally distributed populations, and do not assume that the population standard deviations are equal. Complete parts (a) and n (b) below. Use a 0.01 significance level for both parts. X Treatment Placebo 11 HE 27 31 2.38 2.62 0.89 0.62 HH,...
I just need Help with part B please
A study was done using a treatment group and a placebo group. The results are shown in the table. Assume that the two samples are independent simple random samples selected from normally distributed populations, and do not assume that the population standard deviations are equal. Complete parts (a) and n (b) below. Use a 0.01 significance level for both parts. X Treatment Placebo 11 HE 27 31 2.38 2.62 0.89 0.62 HH,...
 V2 Given in the table are the BMI statistics for random samples of men and women. Assume that the two samples are independent simple random samples selected from normally distributed populations, and do not assume that the population standard deviations are equal. Complete parts (a) and (b) below. Use a 0.05 significance level for both parts. P1 40 28.4029 7.020534 X 40 24.8792 4.562776 5 OC. Hoy H2 HH1 H2 D. Ho: 11 12 на: 4 #2 The test statistic,...
 9.2.01 Treatment Placebo group and from norruse 0.055 A study was done using a treatment group and a placebo group. The results are shown in the table. Assume that the two samples are independent simple random samples selected from normally distributed populations, and do not assume that the population standard deviations are equal. Complete parts (a) and (b) below. Use a 0.05 significance level for both parts. n x 25 2.31 0.66 2.61 0.92 O C. Ho: H1 H2 Hy:...
 A study was done using a treatment group and a placebo group. The results are shown in the table. Assume that the two samples are independent simple random samples selected from normally distributed populations, and do not assume that the population standard deviations are equal. Complete parts (a) and (b) below. Use a 0.10 significance level for both parts. n Treatment Placebo H2 34 40 2.39 2.62 0.56 0.85 X S UU. 110 H1 H2 H:H1 H2 UU. 110-11-12 HH1...
 Treatment Placebo A study was done using a treatment group and a placebo group. The results are shown in the table. Assume that the two samples are independent simple random samples selected from normally distributed populations, and do not assume that Hy the population standard deviations are equal. Complete parts (a) and (b) below. Use a 0.06 significance level for both parts. In 35 3a x 2.32 2.69 5 0 . 0.56 a. Test the claim that the two samples...
 1.
Identify the test
statistic.
Z=_____(Round to two decimal places as needed.)
Identify the P-value.
P=_____(Round to three decimal places as needed.)
What is the conclusion based on the hypothesis test?
The P-value is (1)_____ the significance level of α=0.05, so
(2)_____ the null hypothesis. There (3)_____ evidence to warrant
rejection of the claim that women and men have equal success in
challenging calls.
b. Test the claim by constructing an appropriate confidence
interval.
The 95% or 99% confidence interval...
1.
Identify the test
statistic.
Z=_____(Round to two decimal places as needed.)
Identify the P-value.
P=_____(Round to three decimal places as needed.)
What is the conclusion based on the hypothesis test?
The P-value is (1)_____ the significance level of α=0.05, so
(2)_____ the null hypothesis. There (3)_____ evidence to warrant
rejection of the claim that women and men have equal success in
challenging calls.
b. Test the claim by constructing an appropriate confidence
interval.
The 95% or 99% confidence interval...
 A study was done using a treatment group and a placebo group. The results are shown in the table. Assume that the two samples are independent simple random samples selected from nom assume that the population standard deviations are equal. Complete all parts below. Use a 0.05 significance level Test the claim that the two samples are from populations with the same mean. What are the null and alternative hypotheses? O A. Ho: *12 H₂ H <H2 C. Hos H,...
Most questions answered within 3 hours.
-
Where is the error in this code sequence?
String s1 = "Hello";
String s2 = "ello";...
asked 10 months ago -
Financial data for Joel de Paris, Inc., for last year
follow:
Joel de Paris, Inc.
Balance...
asked 10 months ago -
Consider this reaction:
Al2(SO4)3 (aq)+ BaCl3
(aq) Al2Cl6 (aq)- +
3BaSO4(s) . What is the...
asked 10 months ago -
Suppose that Savneet is considering increasing her
recent random sample from 20 car rentals to 40...
asked 10 months ago -
Trucks arrive at an unloading terminal at an average rate of 120
per hour.
Trucks arrive...
asked 10 months ago -
Why are methanol and ethanol completely soluble in water while
octanol is not very little soluble....
asked 10 months ago -
A facilities manager at a university reads in a research report
that the mean amount of...
asked 10 months ago -
When the CuSO4 is rehydrated by adding water to the anhydrous
compound, is this an endothermic...
asked 10 months ago -
A ray of sunlight is passing from diamond into crown glass; the
angle of incidence is...
asked 10 months ago -
A block of mass 0.249 kg is placed on top of a light, vertical
spring of...
asked 10 months ago -
how do the kidneys compensate in the presences of acidosis
a) trigger hyperventilate
b) reserve acid...
asked 10 months ago -
Question 501 pts
The rental rate of capital to the firm increases. Which of the
following...
asked 10 months ago