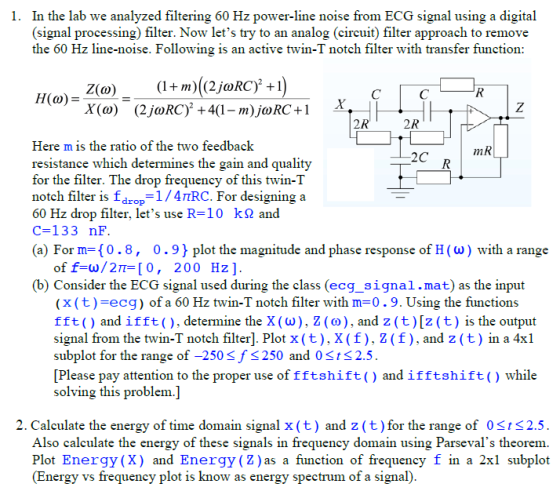
I need help with number 2 . Please answer in MATLAB thank you!
Homework Answers
The following is the MATLAB code to calculate the energy of signals x(t) and z(t) in both time and frequency domains and plot Energy(X) and Energy(Z) as a function of frequency:
ecg_signal=load('ecg_signal.mat', '-ascii');
x=ecg_signal(:,2);
t=ecg_signal(:,1);
m=[0.8,0.9];
C=133*10^(-9);
R=10000;
N=length(x);
f= linspace(-250, 250, N);
w=2*pi*f;
H2=((1+m(2))*((2*i*w*R*C).^2+1))./((2*i*w*R*C).^2+4*(1-m(2))*i*w*R*C+1);
X=fft(x);
Z=X'.*H2;
z=ifft(Z);
Ex=sum(abs(x.^2));
fprintf('Energy of signal x(t) in time domain is: \n')
disp(Ex)
Ez=sum(abs(z.^2));
fprintf('Energy of signal z(t) in time domain is: \n')
disp(Ez)
Exf=sum(abs(X.^2))/N;
fprintf('Energy of signal x(t) in frequency domain is: \n')
disp(Ex)
Ezf=sum(abs(X.^2))/N;
fprintf('Energy of signal z(t) in frequency domain is: \n')
disp(Ez)
Energyx(1)=0;
for i=2:N
Energyx(i)=Energyx(i-1)+(X(i))^2;
end
subplot(2,1,1)
plot(f,abs(Energyx/N))
xlabel('f')
ylabel('Energy(X)')
Energyz(1)=0;
for i=2:N
Energyz(i)=Energyz(i-1)+(Z(i))^2;
end
subplot(2,1,2)
plot(f,abs(Energyz/N))
xlabel('f')
ylabel('Energy(Z)')
The following is the MATLAB output:
Energy of signal x(t) in time domain is:
4.8968
Energy of signal z(t) in time domain is:
17.6890
Energy of signal x(t) in frequency domain is:
4.8968
Energy of signal z(t) in frequency domain is:
17.6890
The plot is shown below:
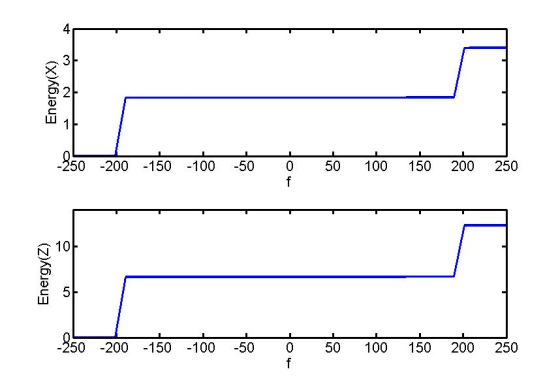
Note: The values and the waveforms changes based on the uploaded ecg_signal.
Add Answer to:
I need help with number 2 . Please answer in MATLAB thank you! 1. In the lab we analyzed filtering 60 Hz power-line noi...
(MATLAB question) "ecg_signal.mat" converted to a .csv file yields the following data; This is only part of th...
(MATLAB question) "ecg_signal.mat" converted to a .csv file yields the following data; This is only part of the whole .mat file. Please show how to analyze the whole signal from this snapshot. 1. In the lab we analyzed filtering 60 Hz power-line noise from ECG signal using a digital (signal processing) filter. Now let's try to an analog (circuit) filter approach to remove the 60 Hz line-noise. Following is an active twin-T notch filter with transfer function: 2R 2R Here...
Please answer in MATLAB, thank you! 2. Calculate the energy of time domain signal x (t) and z (t) for the range of 0SIS...
 Please answer in MATLAB, thank you!
2. Calculate the energy of time domain signal x (t) and z (t) for the range of 0SIS2.5 Also calculate the energy of these signals in frequency domain using Parseval's theorem. Plot Energy (X) and Energy (Z) as a function of frequency f in a 2xl subplot (Energy vs frequency plot is know as energy spectrum of a signal).
2. Calculate the energy of time domain signal x (t) and z (t) for the...
Please answer in MATLAB, thank you!
2. Calculate the energy of time domain signal x (t) and z (t) for the range of 0SIS2.5 Also calculate the energy of these signals in frequency domain using Parseval's theorem. Plot Energy (X) and Energy (Z) as a function of frequency f in a 2xl subplot (Energy vs frequency plot is know as energy spectrum of a signal).
2. Calculate the energy of time domain signal x (t) and z (t) for the...
using Matlab: 1) Design an FIR notch filter using zero placement to remove power-line noise at...
using Matlab: 1) Design an FIR notch filter using zero placement to remove power-line noise at 60 Hz (use file ecg_60hz_200, fs = 200 Hz). 2) Design a LP Butterworth filter with cut-off frequency of 40 Hz to remove high-frequency noise (use file ecg_hfn.dat, fs = 1000 Hz). 3) Design an Elliptic HP filter with passband ripple of 0.01 dB and stopband attenuation of 50 dB and cut-off frequency of 0.5 Hz to remove low-frequency noise (use file ecg_lfn.dat, fs...
Please answer FAST ASAP I will rate you thumbs up ?? (1) What are the reasons...
 Please answer FAST ASAP I will rate you thumbs up
??
(1) What are the reasons behind the need of modulation for radio transmission, i.e., why not directly transmit the original signal? Q2) A carrier signal with frequency f. Hz is double-sideband suppressed carrier (DSB-SC) amplitude modulated by a triangular shaped message signal, m(t), plotted below (Fig. Q2). The DSB-SC amplitude modulated signal is then passed from a band-pass filter with center frequency fc-Im and bandwidth 2fm where fm =...
Please answer FAST ASAP I will rate you thumbs up
??
(1) What are the reasons behind the need of modulation for radio transmission, i.e., why not directly transmit the original signal? Q2) A carrier signal with frequency f. Hz is double-sideband suppressed carrier (DSB-SC) amplitude modulated by a triangular shaped message signal, m(t), plotted below (Fig. Q2). The DSB-SC amplitude modulated signal is then passed from a band-pass filter with center frequency fc-Im and bandwidth 2fm where fm =...
Please finish these questions. Thank you Given find the Fourier transform of the following: (a) e dt 2T(2 1) 4 cos (2t) (Using properties of Fourier Transform to find) a) Suppose a signal m(t) is giv...
 Please finish these questions. Thank you
Given find the Fourier transform of the following: (a) e dt 2T(2 1) 4 cos (2t) (Using properties of Fourier Transform to find) a) Suppose a signal m(t) is given by m()-1+sin(2 fm) where fm-10 Hz. Sketch the signal m(t) in time domain b) Find the Fourier transform M(jo) of m(t) and sketch the magnitude of M(jo) c) If m(t) is amplitude modulated with a carrier signal by x(t)-m(t)cos(27r f,1) (where fe-1000 Hz), sketch...
Please finish these questions. Thank you
Given find the Fourier transform of the following: (a) e dt 2T(2 1) 4 cos (2t) (Using properties of Fourier Transform to find) a) Suppose a signal m(t) is given by m()-1+sin(2 fm) where fm-10 Hz. Sketch the signal m(t) in time domain b) Find the Fourier transform M(jo) of m(t) and sketch the magnitude of M(jo) c) If m(t) is amplitude modulated with a carrier signal by x(t)-m(t)cos(27r f,1) (where fe-1000 Hz), sketch...
I need help completing the answer the formula's is given for each part. Thank you. The...
 I need help completing the answer the formula's is given for
each part. Thank you.
The provided series RLC circuit is in a sinusoidal steady state at a frequency of 60 Hz. V = 100 V, R = 20 L = 15 mH.C = 150 F (t) Cl2 a) Calculate the magnitude (12) and phase angle () of the load. XL2WL عليا function of z = f(R, XL, XC) M = f(R, XL,XC) b) Calculate the source currentl. JE VLO...
I need help completing the answer the formula's is given for
each part. Thank you.
The provided series RLC circuit is in a sinusoidal steady state at a frequency of 60 Hz. V = 100 V, R = 20 L = 15 mH.C = 150 F (t) Cl2 a) Calculate the magnitude (12) and phase angle () of the load. XL2WL عليا function of z = f(R, XL, XC) M = f(R, XL,XC) b) Calculate the source currentl. JE VLO...
PLEASE ANSWERS TO ALL QUESTIONS NEEDED, THANKS Problem 13.10(a) Purpose: This is to help familiarize you...
PLEASE ANSWERS TO ALL QUESTIONS NEEDED, THANKS Problem 13.10(a) Purpose: This is to help familiarize you with characteristics of electromagnetic waves. Problem: An electromagnetic wave travels in the z direction. The electric field in the wave is given by the expression E(z,t) = E0cos(kz-ωt)y. (Bold letter are vectors.) At z = 0 and t = 0, in what direction does the magnetic field point? Hints: Remember that E crossed into B gives the direction of travel. Enter your answer,...
Can you please help me answer Task 2.b? Please show all work. fs=44100; no_pts=8192; t=([0:no_pts-1]')/fs; y1=sin(2...
 Can you please help me answer Task 2.b?
Please show all work.
fs=44100; no_pts=8192;
t=([0:no_pts-1]')/fs;
y1=sin(2*pi*1000*t);
figure;
plot(t,y1);
xlabel('t (second)')
ylabel('y(t)')
axis([0,.004,-1.2,1.2]) % constrain axis so you can actually see
the wave
sound(y1,fs); % play sound using windows driver.
%%
% Check the frequency domain signal. fr is the frequency vector and
f1 is the magnitude of F{y1}.
fr=([0:no_pts-1]')/no_pts*fs; %in Hz
fr=fr(1:no_pts/2); % single-sided spectrum
f1=abs(fft(y1)); % compute fft
f1=f1(1:no_pts/2)/fs;
%%
% F is the continuous time Fourier. (See derivation...
Can you please help me answer Task 2.b?
Please show all work.
fs=44100; no_pts=8192;
t=([0:no_pts-1]')/fs;
y1=sin(2*pi*1000*t);
figure;
plot(t,y1);
xlabel('t (second)')
ylabel('y(t)')
axis([0,.004,-1.2,1.2]) % constrain axis so you can actually see
the wave
sound(y1,fs); % play sound using windows driver.
%%
% Check the frequency domain signal. fr is the frequency vector and
f1 is the magnitude of F{y1}.
fr=([0:no_pts-1]')/no_pts*fs; %in Hz
fr=fr(1:no_pts/2); % single-sided spectrum
f1=abs(fft(y1)); % compute fft
f1=f1(1:no_pts/2)/fs;
%%
% F is the continuous time Fourier. (See derivation...
please answer all prelab questions, 1-4. This is the prelab manual, just in case you need...
 please answer all prelab questions, 1-4.
This is the prelab manual, just in case you need background
information to answer the questions. The prelab questions are in
the 3rd photo.
this where we put in the answers, just to give you an
idea.
Lab Manual Lab 9: Simple Harmonic Oscillation Before the lab, read the theory in Sections 1-3 and answer questions on Pre-lab Submit your Pre-lab at the beginning of the lab. During the lab, read Section 4 and...
please answer all prelab questions, 1-4.
This is the prelab manual, just in case you need background
information to answer the questions. The prelab questions are in
the 3rd photo.
this where we put in the answers, just to give you an
idea.
Lab Manual Lab 9: Simple Harmonic Oscillation Before the lab, read the theory in Sections 1-3 and answer questions on Pre-lab Submit your Pre-lab at the beginning of the lab. During the lab, read Section 4 and...
 Please answer in MATLAB, thank you!
2. Calculate the energy of time domain signal x (t) and z (t) for the range of 0SIS2.5 Also calculate the energy of these signals in frequency domain using Parseval's theorem. Plot Energy (X) and Energy (Z) as a function of frequency f in a 2xl subplot (Energy vs frequency plot is know as energy spectrum of a signal).
2. Calculate the energy of time domain signal x (t) and z (t) for the...
Please answer in MATLAB, thank you!
2. Calculate the energy of time domain signal x (t) and z (t) for the range of 0SIS2.5 Also calculate the energy of these signals in frequency domain using Parseval's theorem. Plot Energy (X) and Energy (Z) as a function of frequency f in a 2xl subplot (Energy vs frequency plot is know as energy spectrum of a signal).
2. Calculate the energy of time domain signal x (t) and z (t) for the...
 Please answer FAST ASAP I will rate you thumbs up
??
(1) What are the reasons behind the need of modulation for radio transmission, i.e., why not directly transmit the original signal? Q2) A carrier signal with frequency f. Hz is double-sideband suppressed carrier (DSB-SC) amplitude modulated by a triangular shaped message signal, m(t), plotted below (Fig. Q2). The DSB-SC amplitude modulated signal is then passed from a band-pass filter with center frequency fc-Im and bandwidth 2fm where fm =...
Please answer FAST ASAP I will rate you thumbs up
??
(1) What are the reasons behind the need of modulation for radio transmission, i.e., why not directly transmit the original signal? Q2) A carrier signal with frequency f. Hz is double-sideband suppressed carrier (DSB-SC) amplitude modulated by a triangular shaped message signal, m(t), plotted below (Fig. Q2). The DSB-SC amplitude modulated signal is then passed from a band-pass filter with center frequency fc-Im and bandwidth 2fm where fm =...
 Please finish these questions. Thank you
Given find the Fourier transform of the following: (a) e dt 2T(2 1) 4 cos (2t) (Using properties of Fourier Transform to find) a) Suppose a signal m(t) is given by m()-1+sin(2 fm) where fm-10 Hz. Sketch the signal m(t) in time domain b) Find the Fourier transform M(jo) of m(t) and sketch the magnitude of M(jo) c) If m(t) is amplitude modulated with a carrier signal by x(t)-m(t)cos(27r f,1) (where fe-1000 Hz), sketch...
Please finish these questions. Thank you
Given find the Fourier transform of the following: (a) e dt 2T(2 1) 4 cos (2t) (Using properties of Fourier Transform to find) a) Suppose a signal m(t) is given by m()-1+sin(2 fm) where fm-10 Hz. Sketch the signal m(t) in time domain b) Find the Fourier transform M(jo) of m(t) and sketch the magnitude of M(jo) c) If m(t) is amplitude modulated with a carrier signal by x(t)-m(t)cos(27r f,1) (where fe-1000 Hz), sketch...
 I need help completing the answer the formula's is given for
each part. Thank you.
The provided series RLC circuit is in a sinusoidal steady state at a frequency of 60 Hz. V = 100 V, R = 20 L = 15 mH.C = 150 F (t) Cl2 a) Calculate the magnitude (12) and phase angle () of the load. XL2WL عليا function of z = f(R, XL, XC) M = f(R, XL,XC) b) Calculate the source currentl. JE VLO...
I need help completing the answer the formula's is given for
each part. Thank you.
The provided series RLC circuit is in a sinusoidal steady state at a frequency of 60 Hz. V = 100 V, R = 20 L = 15 mH.C = 150 F (t) Cl2 a) Calculate the magnitude (12) and phase angle () of the load. XL2WL عليا function of z = f(R, XL, XC) M = f(R, XL,XC) b) Calculate the source currentl. JE VLO...
 Can you please help me answer Task 2.b?
Please show all work.
fs=44100; no_pts=8192;
t=([0:no_pts-1]')/fs;
y1=sin(2*pi*1000*t);
figure;
plot(t,y1);
xlabel('t (second)')
ylabel('y(t)')
axis([0,.004,-1.2,1.2]) % constrain axis so you can actually see
the wave
sound(y1,fs); % play sound using windows driver.
%%
% Check the frequency domain signal. fr is the frequency vector and
f1 is the magnitude of F{y1}.
fr=([0:no_pts-1]')/no_pts*fs; %in Hz
fr=fr(1:no_pts/2); % single-sided spectrum
f1=abs(fft(y1)); % compute fft
f1=f1(1:no_pts/2)/fs;
%%
% F is the continuous time Fourier. (See derivation...
Can you please help me answer Task 2.b?
Please show all work.
fs=44100; no_pts=8192;
t=([0:no_pts-1]')/fs;
y1=sin(2*pi*1000*t);
figure;
plot(t,y1);
xlabel('t (second)')
ylabel('y(t)')
axis([0,.004,-1.2,1.2]) % constrain axis so you can actually see
the wave
sound(y1,fs); % play sound using windows driver.
%%
% Check the frequency domain signal. fr is the frequency vector and
f1 is the magnitude of F{y1}.
fr=([0:no_pts-1]')/no_pts*fs; %in Hz
fr=fr(1:no_pts/2); % single-sided spectrum
f1=abs(fft(y1)); % compute fft
f1=f1(1:no_pts/2)/fs;
%%
% F is the continuous time Fourier. (See derivation...
 please answer all prelab questions, 1-4.
This is the prelab manual, just in case you need background
information to answer the questions. The prelab questions are in
the 3rd photo.
this where we put in the answers, just to give you an
idea.
Lab Manual Lab 9: Simple Harmonic Oscillation Before the lab, read the theory in Sections 1-3 and answer questions on Pre-lab Submit your Pre-lab at the beginning of the lab. During the lab, read Section 4 and...
please answer all prelab questions, 1-4.
This is the prelab manual, just in case you need background
information to answer the questions. The prelab questions are in
the 3rd photo.
this where we put in the answers, just to give you an
idea.
Lab Manual Lab 9: Simple Harmonic Oscillation Before the lab, read the theory in Sections 1-3 and answer questions on Pre-lab Submit your Pre-lab at the beginning of the lab. During the lab, read Section 4 and...
Most questions answered within 3 hours.
-
Where is the error in this code sequence?
String s1 = "Hello";
String s2 = "ello";...
asked 11 months ago -
Financial data for Joel de Paris, Inc., for last year
follow:
Joel de Paris, Inc.
Balance...
asked 11 months ago -
Consider this reaction:
Al2(SO4)3 (aq)+ BaCl3
(aq) Al2Cl6 (aq)- +
3BaSO4(s) . What is the...
asked 11 months ago -
Suppose that Savneet is considering increasing her
recent random sample from 20 car rentals to 40...
asked 11 months ago -
Trucks arrive at an unloading terminal at an average rate of 120
per hour.
Trucks arrive...
asked 11 months ago -
Why are methanol and ethanol completely soluble in water while
octanol is not very little soluble....
asked 11 months ago -
A facilities manager at a university reads in a research report
that the mean amount of...
asked 11 months ago -
When the CuSO4 is rehydrated by adding water to the anhydrous
compound, is this an endothermic...
asked 11 months ago -
A ray of sunlight is passing from diamond into crown glass; the
angle of incidence is...
asked 11 months ago -
A block of mass 0.249 kg is placed on top of a light, vertical
spring of...
asked 11 months ago -
how do the kidneys compensate in the presences of acidosis
a) trigger hyperventilate
b) reserve acid...
asked 11 months ago -
Question 501 pts
The rental rate of capital to the firm increases. Which of the
following...
asked 11 months ago