Use the following data and determine the se. x y (y − ŷ) 5 49 4.538 9 38 0.657 11 32 -1.783 12 25 -7.003 1...
Use the following data and determine the
se.
| x | y | (y − ŷ) |
| 5 | 49 | 4.538 |
| 9 | 38 | 0.657 |
| 11 | 32 | -1.783 |
| 12 | 25 | -7.003 |
| 19 | 22 | 2.456 |
| 25 | 10 | 1.135 |
(Do not round the intermediate values. Round your
answer to 2 decimal places.)
Homework Answers
The statistic software output for this problem is:
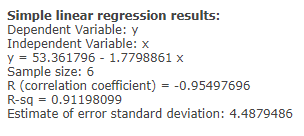
Standard error = Se = 4.49
Add Answer to:
Use the following data and determine the se. x y (y − ŷ) 5 49 4.538 9 38 0.657 11 32 -1.783 12 25 -7.003 1...
Use the following data and determine the se. x y (y − ŷ) 5 47 4.090...
 Use the following data and determine the
se.
x y (y − ŷ)
5 47 4.090
7 38 -1.516
11 32 -0.728
12 27 -4.030
18 22 1.152
25 10 1.032
(Do not round the intermediate values. Round your
answer to 2 decimal places.)
se =
Use the following data and determine the
se.
x y (y − ŷ)
5 47 4.090
7 38 -1.516
11 32 -0.728
12 27 -4.030
18 22 1.152
25 10 1.032
(Do not round the intermediate values. Round your
answer to 2 decimal places.)
se =
se the following data and determine the se. x y (y − ŷ) 5 45 3.798...
se the following data and determine the se. x y (y − ŷ) 5 45 3.798 7 38 -0.214 11 32 -0.236 12 24 -6.742 21 22 4.708 25 10 -1.315
End of Section Problem 12.29 Use the following data and determine the se. х у 5...
 End of Section Problem 12.29 Use the following data and determine the se. х у 5 49 7 38 32 11 (-) 5.788 -1.986 -1.533 -5.920 4.599 -0.949 12 26 21 22 25 10 (Do not round the intermediate values. Round your answer to 2 decimal places.) Se
Consider the following sample data: x 32 23 18 36 13 40 35 24 y 31...
Consider the following sample data: x 32 23 18 36 13 40 35 24 y 31 37 34 60 25 45 43 38 Click here for the Excel Data File b. Calculate b1 and b0. What is the sample regression equation? (Round intermediate calculations to at least 4 decimal places and final answers to 2 decimal places.) yˆy^ + x c. Find the predicted value for y if x equals 11, 16, and 21. (Round intermediate coefficient values and final answers to...
Question 1 Construct a 95% confidence interval for the average value of y for the following...
 Question 1 Construct a 95% confidence interval for the average value of y for the following data. x 12 21 288 20 y 17 15 22 19 24 Use x = 25, se 3.94, and the equation of the regression line, y = 16.5 + 0.162x Do not round the intermediate values. Round your answers to 2 decimal places.)
Game Point_Differential Assists Rebounds Turnovers Personal_Fouls 1 15 15 38 11 9 2 36 20 43 &
 Game
Point_Differential Assists
Rebounds Turnovers Personal_Fouls
1 15 15 38
11 9
2 36 20 43
8 13
3 16 21 29
7 13
4 45 22 46
11 11
5 12 11 40
7 22
6 -10 10 31
13 26
7 11 19 45
11 7
8 12 16 32
16 14
9 3 16 27
18 15
10 19 9 34
17 17
11 40 16 41
9 17
12 44 12 29
9 22
13 16 ...
Game
Point_Differential Assists
Rebounds Turnovers Personal_Fouls
1 15 15 38
11 9
2 36 20 43
8 13
3 16 21 29
7 13
4 45 22 46
11 11
5 12 11 40
7 22
6 -10 10 31
13 26
7 11 19 45
11 7
8 12 16 32
16 14
9 3 16 27
18 15
10 19 9 34
17 17
11 40 16 41
9 17
12 44 12 29
9 22
13 16 ...
13 12 5 15 11 9 co Use the given data to find the equation of...
 13 12 5 15 11 9 co Use the given data to find the equation of the regression line. Examine the scatterplot and identify a characteristic of the data that is ignored by the regression line 10 14 16 38 14.98 16 26 10.38 5.54 155415 80 13 80 16.14 12 26 9-1.x (Round to two decimal places as needed) 8 y 8.14 mil
Determine the equation of the regression line for the following data, and compute the residuals. x...
 Determine the equation of the regression line for the following
data, and compute the residuals.
x
16
7
19
13
4
y
47
36
53
45
18
Do not round the intermediate values. (Round your
answers to 3 decimal places.)
y^=(______)+(________)x
Do not round the intermediate values. (Round your
answers to 3 decimal places.)
Find below's Residuals
x
y
Residuals
16
47
?
7
36
?
19
53
?
13
45
?
4
18
?
Determine the equation of the regression line for the following
data, and compute the residuals.
x
16
7
19
13
4
y
47
36
53
45
18
Do not round the intermediate values. (Round your
answers to 3 decimal places.)
y^=(______)+(________)x
Do not round the intermediate values. (Round your
answers to 3 decimal places.)
Find below's Residuals
x
y
Residuals
16
47
?
7
36
?
19
53
?
13
45
?
4
18
?
Sample Data Sample Data Hour Sample Taken Hour Sample Taken 1 4 5 X 1 3...
 Sample Data Sample Data Hour Sample Taken Hour Sample Taken 1 4 5 X 1 3 1 42 2 3 4 5 6 2 39 36 25 60 28 53 22 56 41 34 43 45 59 42 36 40 45 39 48 26 42 34 61 48 45 29 3 31 61 38 40 54 26 38 42 37 41 53 37 47 41 37 29 20 26 43 38 33 37 37 35 33 36 41 25 37...
Year 1. 2 3 4 5 Returns X Y 12 % 25 % 28 34 9...
 Year 1. 2 3 4 5 Returns X Y 12 % 25 % 28 34 9 13 - 7 - 27 10 14 Using the returns shown above, calculate the arithmetic average returns, the variances, and the standard deviations for X and Y. (Do not round intermediate calculations. Enter your average return and standard deviation as a percent rounded to 2 decimal places, e.g., 32.16, and round the variance to 5 decimal places, e.g., .16161.) % % Average return Variance...
 Use the following data and determine the
se.
x y (y − ŷ)
5 47 4.090
7 38 -1.516
11 32 -0.728
12 27 -4.030
18 22 1.152
25 10 1.032
(Do not round the intermediate values. Round your
answer to 2 decimal places.)
se =
Use the following data and determine the
se.
x y (y − ŷ)
5 47 4.090
7 38 -1.516
11 32 -0.728
12 27 -4.030
18 22 1.152
25 10 1.032
(Do not round the intermediate values. Round your
answer to 2 decimal places.)
se =
 End of Section Problem 12.29 Use the following data and determine the se. х у 5 49 7 38 32 11 (-) 5.788 -1.986 -1.533 -5.920 4.599 -0.949 12 26 21 22 25 10 (Do not round the intermediate values. Round your answer to 2 decimal places.) Se
 Question 1 Construct a 95% confidence interval for the average value of y for the following data. x 12 21 288 20 y 17 15 22 19 24 Use x = 25, se 3.94, and the equation of the regression line, y = 16.5 + 0.162x Do not round the intermediate values. Round your answers to 2 decimal places.)
 Game
Point_Differential Assists
Rebounds Turnovers Personal_Fouls
1 15 15 38
11 9
2 36 20 43
8 13
3 16 21 29
7 13
4 45 22 46
11 11
5 12 11 40
7 22
6 -10 10 31
13 26
7 11 19 45
11 7
8 12 16 32
16 14
9 3 16 27
18 15
10 19 9 34
17 17
11 40 16 41
9 17
12 44 12 29
9 22
13 16 ...
Game
Point_Differential Assists
Rebounds Turnovers Personal_Fouls
1 15 15 38
11 9
2 36 20 43
8 13
3 16 21 29
7 13
4 45 22 46
11 11
5 12 11 40
7 22
6 -10 10 31
13 26
7 11 19 45
11 7
8 12 16 32
16 14
9 3 16 27
18 15
10 19 9 34
17 17
11 40 16 41
9 17
12 44 12 29
9 22
13 16 ...
 13 12 5 15 11 9 co Use the given data to find the equation of the regression line. Examine the scatterplot and identify a characteristic of the data that is ignored by the regression line 10 14 16 38 14.98 16 26 10.38 5.54 155415 80 13 80 16.14 12 26 9-1.x (Round to two decimal places as needed) 8 y 8.14 mil
 Determine the equation of the regression line for the following
data, and compute the residuals.
x
16
7
19
13
4
y
47
36
53
45
18
Do not round the intermediate values. (Round your
answers to 3 decimal places.)
y^=(______)+(________)x
Do not round the intermediate values. (Round your
answers to 3 decimal places.)
Find below's Residuals
x
y
Residuals
16
47
?
7
36
?
19
53
?
13
45
?
4
18
?
Determine the equation of the regression line for the following
data, and compute the residuals.
x
16
7
19
13
4
y
47
36
53
45
18
Do not round the intermediate values. (Round your
answers to 3 decimal places.)
y^=(______)+(________)x
Do not round the intermediate values. (Round your
answers to 3 decimal places.)
Find below's Residuals
x
y
Residuals
16
47
?
7
36
?
19
53
?
13
45
?
4
18
?
 Sample Data Sample Data Hour Sample Taken Hour Sample Taken 1 4 5 X 1 3 1 42 2 3 4 5 6 2 39 36 25 60 28 53 22 56 41 34 43 45 59 42 36 40 45 39 48 26 42 34 61 48 45 29 3 31 61 38 40 54 26 38 42 37 41 53 37 47 41 37 29 20 26 43 38 33 37 37 35 33 36 41 25 37...
 Year 1. 2 3 4 5 Returns X Y 12 % 25 % 28 34 9 13 - 7 - 27 10 14 Using the returns shown above, calculate the arithmetic average returns, the variances, and the standard deviations for X and Y. (Do not round intermediate calculations. Enter your average return and standard deviation as a percent rounded to 2 decimal places, e.g., 32.16, and round the variance to 5 decimal places, e.g., .16161.) % % Average return Variance...
Most questions answered within 3 hours.
-
Where is the error in this code sequence?
String s1 = "Hello";
String s2 = "ello";...
asked 10 months ago -
Financial data for Joel de Paris, Inc., for last year
follow:
Joel de Paris, Inc.
Balance...
asked 10 months ago -
Consider this reaction:
Al2(SO4)3 (aq)+ BaCl3
(aq) Al2Cl6 (aq)- +
3BaSO4(s) . What is the...
asked 10 months ago -
Suppose that Savneet is considering increasing her
recent random sample from 20 car rentals to 40...
asked 10 months ago -
Trucks arrive at an unloading terminal at an average rate of 120
per hour.
Trucks arrive...
asked 10 months ago -
Why are methanol and ethanol completely soluble in water while
octanol is not very little soluble....
asked 10 months ago -
A facilities manager at a university reads in a research report
that the mean amount of...
asked 10 months ago -
When the CuSO4 is rehydrated by adding water to the anhydrous
compound, is this an endothermic...
asked 10 months ago -
A ray of sunlight is passing from diamond into crown glass; the
angle of incidence is...
asked 10 months ago -
A block of mass 0.249 kg is placed on top of a light, vertical
spring of...
asked 10 months ago -
how do the kidneys compensate in the presences of acidosis
a) trigger hyperventilate
b) reserve acid...
asked 10 months ago -
Question 501 pts
The rental rate of capital to the firm increases. Which of the
following...
asked 10 months ago