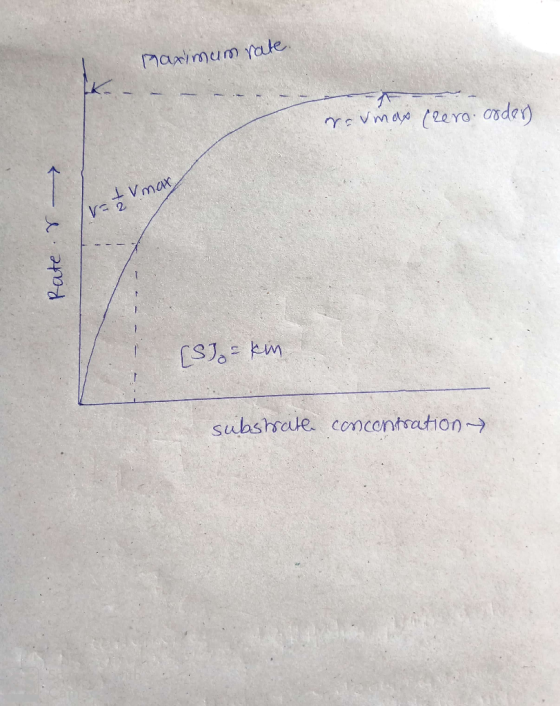
Show mathematically how a value for KM can be obtained from the v0 vs S0 graph when v0 = ½ Vmax
Show mathematically how a value for KM can be obtained from the v0 vs S0 graph when v0 = ½ Vmax
Homework Answers

Add Answer to:
Show mathematically how a value for KM can be obtained from the v0 vs S0 graph when v0 = ½ Vmax
What is the Vmax and Km on this graph for both lines? VO vs [S] 0.0000014...
 What is the Vmax and Km on this graph for both lines?
VO vs [S] 0.0000014 y -0.0698x2 +0.0006x- 2E-08 0.0000013 0.0000012 0.0000011 0.000001 0.0000009 vo 0.0000008 Series2 0.0000007 0.0000006 ...Log.(VO) ...Poly.(V0) 0.0000005 y-0.0074x2 + 0,0001x- 6E-09 Poly.(Series2) 0.0000004 0.0000003 0.0000002 0.0000001 0.01 [S]
What is the Vmax and Km on this graph for both lines?
VO vs [S] 0.0000014 y -0.0698x2 +0.0006x- 2E-08 0.0000013 0.0000012 0.0000011 0.000001 0.0000009 vo 0.0000008 Series2 0.0000007 0.0000006 ...Log.(VO) ...Poly.(V0) 0.0000005 y-0.0074x2 + 0,0001x- 6E-09 Poly.(Series2) 0.0000004 0.0000003 0.0000002 0.0000001 0.01 [S]
How do I calculate the apparent vmax? 16. At right is a graph obtained from a...
 How do I calculate the apparent vmax?
16. At right is a graph obtained from a series of enzyme kinetics assays. The Vmax for this enzyme and substrate is 4.5 M/s. a) What is the KM? 5 4.5 4 3.5 3 2.5 2 1.5 KM: 3mm ve (MM/s) 1 0.5 0 b) If a pure non-competitive inhibitor was added to the assays, what would the resulting kinetics curve be like? Give a Km and Vmax in the presence of the...
How do I calculate the apparent vmax?
16. At right is a graph obtained from a series of enzyme kinetics assays. The Vmax for this enzyme and substrate is 4.5 M/s. a) What is the KM? 5 4.5 4 3.5 3 2.5 2 1.5 KM: 3mm ve (MM/s) 1 0.5 0 b) If a pure non-competitive inhibitor was added to the assays, what would the resulting kinetics curve be like? Give a Km and Vmax in the presence of the...
1. Show, using the Michaelis-Menten equation, that when [S] >>> Km, vo = Vmax. Show, using...
1. Show, using the Michaelis-Menten equation, that when [S] >>> Km, vo = Vmax. Show, using the M-M equation that when [S] <<<Km, vo =[S][Et]kcat/Km. 2. What is Vmax? Provide both a mathematical and written description of Vmax? How can Vmax be experimentally altered? How can we use Vmax to determine the turnover number (kcat) of an enzyme-catalyzed reaction? What is the major challenge of determining Vmax from an Michaelis-Menten plot?
16. At right is a graph obtained from a series of enzyme kinetics assays. The Vmax...
 16. At right is a graph obtained from a series of enzyme kinetics assays. The Vmax for this enzyme and substrate is 4.5 uM/s. 5 4.5 4 a) What is the KM? KM: v. (mM/s) 3.5 3 2.5 2 1.5 1 0.5 b) If a pure non-competitive inhibitor was added to the assays, what would the resulting kinetics curve be like? Give a Km and Vmax in the presence of the inhibitor (write them below) and draw an appropriate curve...
16. At right is a graph obtained from a series of enzyme kinetics assays. The Vmax...
 16. At right is a graph obtained from a series of enzyme kinetics assays. The Vmax for this enzyme and substrate is 4.5 uM/s. a) What is the KM? 5 4.5 4 3.5 3 2.5 2 KM: 3mm V. (mM/s) 1.5 1 b) If a pure non-competitive inhibitor was added to the assays, what would the resulting kinetics curve be like? Give a Km and Vmax in the presence of the inhibitor (write them below) and draw an appropriate curve...
Please show how to calculate Km and Vmax for no inhibitor/low inhibitor given graph. Show how to ...
 Please show how to calculate Km and Vmax for no inhibitor/low
inhibitor given graph. Show how to solve for a.,a/a etc.
Lineweaver Burk #4: No inhibitor, Low inhibitor 0.2 ▲ No inhibitor Low inhibitor 0.15 0.05 0.2 0.15 0.1 0.05 0.05 0.1 0.15 02 5 1/IS] in units of 1/mM Fill in the blanks. Show your work. No inhibitor Kmno Vmax,o- Vmax,w = ๙ Vmax,o Solve for ๙ inhibitor Krmkw =픕Km,o Solve for 픕 Hint treat, as a single number....
Please show how to calculate Km and Vmax for no inhibitor/low
inhibitor given graph. Show how to solve for a.,a/a etc.
Lineweaver Burk #4: No inhibitor, Low inhibitor 0.2 ▲ No inhibitor Low inhibitor 0.15 0.05 0.2 0.15 0.1 0.05 0.05 0.1 0.15 02 5 1/IS] in units of 1/mM Fill in the blanks. Show your work. No inhibitor Kmno Vmax,o- Vmax,w = ๙ Vmax,o Solve for ๙ inhibitor Krmkw =픕Km,o Solve for 픕 Hint treat, as a single number....
Determine the km and vmax from this data. 1/[S] 0.1 0.033333333 0.02 0.01 0.006666667 0.002 1/V0...
Determine the km and vmax from this data. 1/[S] 0.1 0.033333333 0.02 0.01 0.006666667 0.002 1/V0 34.3 31.95 27.2 25.51 20.16 19.6
12. From the Lineweaver-Burk graph given: a. What are the Km and Vmax for the uninhibited...
 12. From the Lineweaver-Burk graph given: a. What are the Km and Vmax for the uninhibited case? b. What type of inhibition is occurring? c. Shown on the page after the Lineweaver-Burk plot are semi-qualitative sketches for three V vs. (S) plots. Which one of these most likely corresponds to this particular experiment (A,B or C)? Scani explain th Cant catimer IIIIIIIII IIIIIIIII - -- | - | IIIII We were unable to transcribe this image
a. What is the Km and Vmax for PFK1 when treated with OmM (represents control for...
 a. What is the Km and Vmax for PFK1 when treated with OmM (represents control for enzymatic activity) or with 5mM AMP Show work on the graph draw lines for Vmax and Km. Control: Vmax (AMP), 0.32 0.28 0.2 Km 0.24 0.20 (s)-FTY20 (20LM): 0.18 Vmax 0.12 0.08 0.04 Km 0.00 Fructose-6-phosphate (mM) b. Fructose-6-phosphate is the substrate of the reaction. Based on answer in "a", what type of regulation occurs with and what site on PFK1 is AMP likely...
How can Planck's constant be deduced from the graph of stopping potential vs frequency of light...
How can Planck's constant be deduced from the graph of stopping potential vs frequency of light ? How can the work function be obtained from this graph?
 What is the Vmax and Km on this graph for both lines?
VO vs [S] 0.0000014 y -0.0698x2 +0.0006x- 2E-08 0.0000013 0.0000012 0.0000011 0.000001 0.0000009 vo 0.0000008 Series2 0.0000007 0.0000006 ...Log.(VO) ...Poly.(V0) 0.0000005 y-0.0074x2 + 0,0001x- 6E-09 Poly.(Series2) 0.0000004 0.0000003 0.0000002 0.0000001 0.01 [S]
What is the Vmax and Km on this graph for both lines?
VO vs [S] 0.0000014 y -0.0698x2 +0.0006x- 2E-08 0.0000013 0.0000012 0.0000011 0.000001 0.0000009 vo 0.0000008 Series2 0.0000007 0.0000006 ...Log.(VO) ...Poly.(V0) 0.0000005 y-0.0074x2 + 0,0001x- 6E-09 Poly.(Series2) 0.0000004 0.0000003 0.0000002 0.0000001 0.01 [S]
 How do I calculate the apparent vmax?
16. At right is a graph obtained from a series of enzyme kinetics assays. The Vmax for this enzyme and substrate is 4.5 M/s. a) What is the KM? 5 4.5 4 3.5 3 2.5 2 1.5 KM: 3mm ve (MM/s) 1 0.5 0 b) If a pure non-competitive inhibitor was added to the assays, what would the resulting kinetics curve be like? Give a Km and Vmax in the presence of the...
How do I calculate the apparent vmax?
16. At right is a graph obtained from a series of enzyme kinetics assays. The Vmax for this enzyme and substrate is 4.5 M/s. a) What is the KM? 5 4.5 4 3.5 3 2.5 2 1.5 KM: 3mm ve (MM/s) 1 0.5 0 b) If a pure non-competitive inhibitor was added to the assays, what would the resulting kinetics curve be like? Give a Km and Vmax in the presence of the...
 16. At right is a graph obtained from a series of enzyme kinetics assays. The Vmax for this enzyme and substrate is 4.5 uM/s. 5 4.5 4 a) What is the KM? KM: v. (mM/s) 3.5 3 2.5 2 1.5 1 0.5 b) If a pure non-competitive inhibitor was added to the assays, what would the resulting kinetics curve be like? Give a Km and Vmax in the presence of the inhibitor (write them below) and draw an appropriate curve...
 16. At right is a graph obtained from a series of enzyme kinetics assays. The Vmax for this enzyme and substrate is 4.5 uM/s. a) What is the KM? 5 4.5 4 3.5 3 2.5 2 KM: 3mm V. (mM/s) 1.5 1 b) If a pure non-competitive inhibitor was added to the assays, what would the resulting kinetics curve be like? Give a Km and Vmax in the presence of the inhibitor (write them below) and draw an appropriate curve...
 Please show how to calculate Km and Vmax for no inhibitor/low
inhibitor given graph. Show how to solve for a.,a/a etc.
Lineweaver Burk #4: No inhibitor, Low inhibitor 0.2 ▲ No inhibitor Low inhibitor 0.15 0.05 0.2 0.15 0.1 0.05 0.05 0.1 0.15 02 5 1/IS] in units of 1/mM Fill in the blanks. Show your work. No inhibitor Kmno Vmax,o- Vmax,w = ๙ Vmax,o Solve for ๙ inhibitor Krmkw =픕Km,o Solve for 픕 Hint treat, as a single number....
Please show how to calculate Km and Vmax for no inhibitor/low
inhibitor given graph. Show how to solve for a.,a/a etc.
Lineweaver Burk #4: No inhibitor, Low inhibitor 0.2 ▲ No inhibitor Low inhibitor 0.15 0.05 0.2 0.15 0.1 0.05 0.05 0.1 0.15 02 5 1/IS] in units of 1/mM Fill in the blanks. Show your work. No inhibitor Kmno Vmax,o- Vmax,w = ๙ Vmax,o Solve for ๙ inhibitor Krmkw =픕Km,o Solve for 픕 Hint treat, as a single number....
 12. From the Lineweaver-Burk graph given: a. What are the Km and Vmax for the uninhibited case? b. What type of inhibition is occurring? c. Shown on the page after the Lineweaver-Burk plot are semi-qualitative sketches for three V vs. (S) plots. Which one of these most likely corresponds to this particular experiment (A,B or C)? Scani explain th Cant catimer IIIIIIIII IIIIIIIII - -- | - | IIIII We were unable to transcribe this image
 a. What is the Km and Vmax for PFK1 when treated with OmM (represents control for enzymatic activity) or with 5mM AMP Show work on the graph draw lines for Vmax and Km. Control: Vmax (AMP), 0.32 0.28 0.2 Km 0.24 0.20 (s)-FTY20 (20LM): 0.18 Vmax 0.12 0.08 0.04 Km 0.00 Fructose-6-phosphate (mM) b. Fructose-6-phosphate is the substrate of the reaction. Based on answer in "a", what type of regulation occurs with and what site on PFK1 is AMP likely...
Most questions answered within 3 hours.
-
Where is the error in this code sequence?
String s1 = "Hello";
String s2 = "ello";...
asked 10 months ago -
Financial data for Joel de Paris, Inc., for last year
follow:
Joel de Paris, Inc.
Balance...
asked 10 months ago -
Consider this reaction:
Al2(SO4)3 (aq)+ BaCl3
(aq) Al2Cl6 (aq)- +
3BaSO4(s) . What is the...
asked 10 months ago -
Suppose that Savneet is considering increasing her
recent random sample from 20 car rentals to 40...
asked 10 months ago -
Trucks arrive at an unloading terminal at an average rate of 120
per hour.
Trucks arrive...
asked 10 months ago -
Why are methanol and ethanol completely soluble in water while
octanol is not very little soluble....
asked 10 months ago -
A facilities manager at a university reads in a research report
that the mean amount of...
asked 10 months ago -
When the CuSO4 is rehydrated by adding water to the anhydrous
compound, is this an endothermic...
asked 10 months ago -
A ray of sunlight is passing from diamond into crown glass; the
angle of incidence is...
asked 10 months ago -
A block of mass 0.249 kg is placed on top of a light, vertical
spring of...
asked 10 months ago -
how do the kidneys compensate in the presences of acidosis
a) trigger hyperventilate
b) reserve acid...
asked 10 months ago -
Question 501 pts
The rental rate of capital to the firm increases. Which of the
following...
asked 10 months ago