12313werqw
 Honey
9 6 14 14 15 12 13 14 7 10 11 14 9 12 13 13 5 5 9 6 7 8 14 7 13
Honey
9 6 14 14 15 12 13 14 7 10 11 14 9 12 13 13 5 5 9 6 7 8 14 7 13
DM 5 5 12 6 11 7 13 7 7 5 6 5 9 5 13 11 13 7 10 8
control 2 4 4 3 1 9 7 4 9 8 2 8 6 4 2 5
- Calculate the mean, median and mode for each of the data (Honey, DM and Control).
- Calculate the range, variance and standard deviation for each of the data (Honey, DM and Control).
- Calculate the coefficient of variation for each of the data (Honey, DM and Control).
- Based on the results from (c), above, which group appears to have the most variability in coughing improvement? Which one shows the least variability in coughing improvement?
show your working, thanks!
Homework Answers
Request Answer!
We need at least 10 more requests to produce the answer.
0 / 10 have requested this problem solution
The more requests, the faster the answer.
Add Answer to:
12313werqw Honey 9 6 14 14 15 12 13 14 7 10 11 14 9 12 13 13 5 5 9 6 7 8 14 7 13 DM 5 5 12 6 11 7 13 7 7 5 6 5 9 5 13 11...
2.4.68 A study was done of honey as a remedy for coughing. The coughing improvement scores...
2.4.68 A study was done of honey as a remedy for coughing. The coughing improvement scores (as determined by the children's parents) for the patients in the over-the-counter cough medicine dosage (DM) group, honey dosage group, and control group are reproduced in the accompanying table. Complete parts a through d below. LOADING... Click the icon to view the table of coughing improvement scores. a. Find the standard deviation of the improvement scores for the honey dosage group. The standard deviation...
A drug company developed a honey based liquid medicine designed to calm a chids cough at...
 A drug company developed a honey based liquid medicine designed to calm a chids cough at night. To test the drug. 105 children who were it with an upper respiratory tract infection were randomly selected to participate in a clinical trial. The children were randomly divided into three groups one group was given a dosage of the honey drug the second was given a dosage of liquid DM (an over-the-counter cough medicine), and the third control group) received aliquid placebo...
Solve the problem. A drug company developed a honey-based liquid medicine designed to calm a child's...
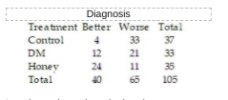 Solve the problem.
A drug company developed a honey-based liquid medicine designed to
calm a child's cough at night. To test the drug, 105 children who
were ill with an upper respiratory tract infection were randomly
selected to participate in a clinical trial. The children were
randomly divided into three groups - one group was given a dosage
of the honey drug, the second was given a dosage of liquid DM (an
over-the-counter cough medicine), and the third (control group)...
Solve the problem.
A drug company developed a honey-based liquid medicine designed to
calm a child's cough at night. To test the drug, 105 children who
were ill with an upper respiratory tract infection were randomly
selected to participate in a clinical trial. The children were
randomly divided into three groups - one group was given a dosage
of the honey drug, the second was given a dosage of liquid DM (an
over-the-counter cough medicine), and the third (control group)...
A drug company developed a honey-based liquid medicine designed to calm a child's cough at night....
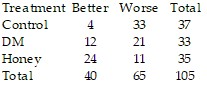 A drug company developed a honey-based liquid medicine designed
to calm a child's cough at night. To test the drug, 105 children
who were ill with an upper respiratory tract infection were
randomly selected to participate in a clinical trial. The children
were randomly divided into three groups - one group was given a
dosage of the honey drug, the second was given a dosage of liquid
DM (an over-the-counter cough medicine), and the third (control
group) received a liquid...
A drug company developed a honey-based liquid medicine designed
to calm a child's cough at night. To test the drug, 105 children
who were ill with an upper respiratory tract infection were
randomly selected to participate in a clinical trial. The children
were randomly divided into three groups - one group was given a
dosage of the honey drug, the second was given a dosage of liquid
DM (an over-the-counter cough medicine), and the third (control
group) received a liquid...
x y 5 6 6 9 7 11 8 13 9 14 10 15 11 15...
x y 5 6 6 9 7 11 8 13 9 14 10 15 11 15 12 13 a) Generate a model for y as a function of x b) Is this model useful? Justify your conclusion based on i) R2 adjusted, ii) Hypothesis test for model coefficient, iii) overall model adequacy test and iv) regression assumptions c) If needed, modify model as appropriate and generate the new model. *Complete all parts of the problem please, be as detailed with...
Let U - (7, 8, 9, 10, 11, 12, 13, 14, 15, 16). A - 17,...
 Let U - (7, 8, 9, 10, 11, 12, 13, 14, 15, 16). A - 17, 9, 11, 13, 15), B = {8, 10, 12, 14, 16), and C (7, 8, 10, 11, 14, 15). List the elements of each set. (Enter your answers using roster notation Enter EMPTY or for the empty set.) (a) Anonco (6) AU BUBNC (c) (A U BY C
Drive 1 2 3 4 5 6 7 8 9 10 11 12 13 14 15...
 Drive 1 2 3 4 5 6 7 8 9 10 11 12 13 14 15 16 17 16) Calculate the equivalent capacitance from points A to B using the figure if each capacitor has a capacitance of 1.0uF earch Dashb Enter your response Gm Answer Chapter 19- Homework Due Fri Mar 15th
Let U = {7, 8, 9, 10, 11, 12, 13, 14, 15, 16), A = {7,...
 Let U = {7, 8, 9, 10, 11, 12, 13, 14, 15, 16), A = {7, 9, 11, 13, 15), B = (8, 10, 12, 14, 16), and C (7, 8, 10, 11, 14, 15). List the elements of each set (Enter your answers using roster notation. Enter EMPTY or for the empty set.) (a) A( BC) (b) AU B9) (anc (c) (A U BENCE
Given the array A = (5, 7, 14, 8, 11, 15, 9, 13, 12, 10), show...
 Given the array A = (5, 7, 14, 8, 11, 15, 9, 13, 12, 10), show how the Insertion sort and Quicksort algorithms work. Step through each algorithm, illustrating how it modifies the input array A. State the worst- and best-case computational complexity of the two algorithms in terms of the size |A| of the input array, and explain why.
- 5 8 9 - 10 - 11 12 - 13 14 15 16 Below are...
 - 5 8 9 - 10 - 11 12 - 13 14 15 16 Below are the times (in days) it takes for a sample of 16 customers from Sarah's computer store to pay their invoices. 19,15,43, 39, 35, 31, 27, 22, 34, 34, 34, 30, 30, 30, 26, 26 Draw the frequency polygon for these data using an initial class boundary of 14.5 and a class width of 7. Note that you can add or remove classes from the...
 A drug company developed a honey based liquid medicine designed to calm a chids cough at night. To test the drug. 105 children who were it with an upper respiratory tract infection were randomly selected to participate in a clinical trial. The children were randomly divided into three groups one group was given a dosage of the honey drug the second was given a dosage of liquid DM (an over-the-counter cough medicine), and the third control group) received aliquid placebo...
 Solve the problem.
A drug company developed a honey-based liquid medicine designed to
calm a child's cough at night. To test the drug, 105 children who
were ill with an upper respiratory tract infection were randomly
selected to participate in a clinical trial. The children were
randomly divided into three groups - one group was given a dosage
of the honey drug, the second was given a dosage of liquid DM (an
over-the-counter cough medicine), and the third (control group)...
Solve the problem.
A drug company developed a honey-based liquid medicine designed to
calm a child's cough at night. To test the drug, 105 children who
were ill with an upper respiratory tract infection were randomly
selected to participate in a clinical trial. The children were
randomly divided into three groups - one group was given a dosage
of the honey drug, the second was given a dosage of liquid DM (an
over-the-counter cough medicine), and the third (control group)...
 A drug company developed a honey-based liquid medicine designed
to calm a child's cough at night. To test the drug, 105 children
who were ill with an upper respiratory tract infection were
randomly selected to participate in a clinical trial. The children
were randomly divided into three groups - one group was given a
dosage of the honey drug, the second was given a dosage of liquid
DM (an over-the-counter cough medicine), and the third (control
group) received a liquid...
A drug company developed a honey-based liquid medicine designed
to calm a child's cough at night. To test the drug, 105 children
who were ill with an upper respiratory tract infection were
randomly selected to participate in a clinical trial. The children
were randomly divided into three groups - one group was given a
dosage of the honey drug, the second was given a dosage of liquid
DM (an over-the-counter cough medicine), and the third (control
group) received a liquid...
 Let U - (7, 8, 9, 10, 11, 12, 13, 14, 15, 16). A - 17, 9, 11, 13, 15), B = {8, 10, 12, 14, 16), and C (7, 8, 10, 11, 14, 15). List the elements of each set. (Enter your answers using roster notation Enter EMPTY or for the empty set.) (a) Anonco (6) AU BUBNC (c) (A U BY C
 Drive 1 2 3 4 5 6 7 8 9 10 11 12 13 14 15 16 17 16) Calculate the equivalent capacitance from points A to B using the figure if each capacitor has a capacitance of 1.0uF earch Dashb Enter your response Gm Answer Chapter 19- Homework Due Fri Mar 15th
 Let U = {7, 8, 9, 10, 11, 12, 13, 14, 15, 16), A = {7, 9, 11, 13, 15), B = (8, 10, 12, 14, 16), and C (7, 8, 10, 11, 14, 15). List the elements of each set (Enter your answers using roster notation. Enter EMPTY or for the empty set.) (a) A( BC) (b) AU B9) (anc (c) (A U BENCE
 Given the array A = (5, 7, 14, 8, 11, 15, 9, 13, 12, 10), show how the Insertion sort and Quicksort algorithms work. Step through each algorithm, illustrating how it modifies the input array A. State the worst- and best-case computational complexity of the two algorithms in terms of the size |A| of the input array, and explain why.
 - 5 8 9 - 10 - 11 12 - 13 14 15 16 Below are the times (in days) it takes for a sample of 16 customers from Sarah's computer store to pay their invoices. 19,15,43, 39, 35, 31, 27, 22, 34, 34, 34, 30, 30, 30, 26, 26 Draw the frequency polygon for these data using an initial class boundary of 14.5 and a class width of 7. Note that you can add or remove classes from the...
Most questions answered within 3 hours.
-
Where is the error in this code sequence?
String s1 = "Hello";
String s2 = "ello";...
asked 11 months ago -
Financial data for Joel de Paris, Inc., for last year
follow:
Joel de Paris, Inc.
Balance...
asked 11 months ago -
Consider this reaction:
Al2(SO4)3 (aq)+ BaCl3
(aq) Al2Cl6 (aq)- +
3BaSO4(s) . What is the...
asked 11 months ago -
Suppose that Savneet is considering increasing her
recent random sample from 20 car rentals to 40...
asked 11 months ago -
Trucks arrive at an unloading terminal at an average rate of 120
per hour.
Trucks arrive...
asked 11 months ago -
Why are methanol and ethanol completely soluble in water while
octanol is not very little soluble....
asked 11 months ago -
A facilities manager at a university reads in a research report
that the mean amount of...
asked 11 months ago -
When the CuSO4 is rehydrated by adding water to the anhydrous
compound, is this an endothermic...
asked 11 months ago -
A ray of sunlight is passing from diamond into crown glass; the
angle of incidence is...
asked 11 months ago -
A block of mass 0.249 kg is placed on top of a light, vertical
spring of...
asked 11 months ago -
how do the kidneys compensate in the presences of acidosis
a) trigger hyperventilate
b) reserve acid...
asked 11 months ago -
Question 501 pts
The rental rate of capital to the firm increases. Which of the
following...
asked 11 months ago