 Please provide hand-written explanation
Homework Answers


Add Answer to:
Please provide hand-written explanation • 4.29 The number of disk drives (in millions) made at a plant in Taiwan dur...
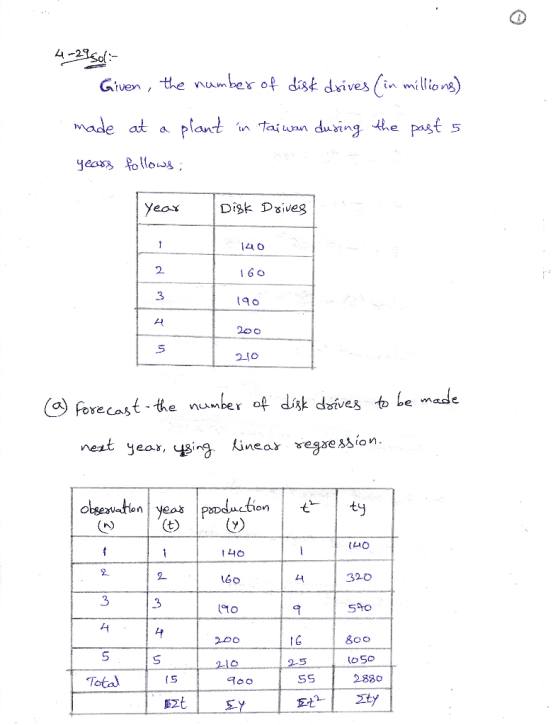
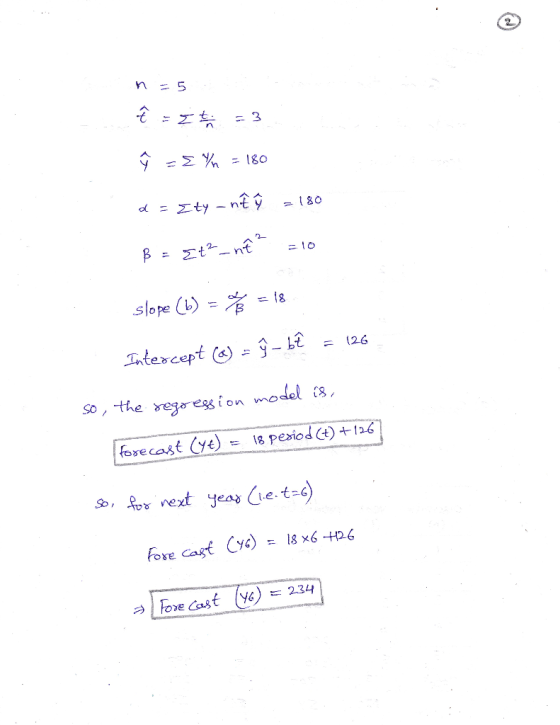
The number of disk drives (in millions) made at a plant in Taiwan during the past 5 years follows...
The number of disk drives (in millions) made at a plant in Taiwan during the past 5 years follows: YEAR DISK DRIVES 1 140 2 160 3 190 4 200 5 210 Forecast the number of disk drives to be made next year, using linear regression. Compute the mean squared error (MSE) when using linear regression. Compute the mean absolute percent error (MAPE).
The number of internal disk drives (in millions) made at a plant in Taiwan during the...
The number of internal disk drives (in millions) made at a plant in Taiwan during the past 5 years follows: year 1: 142 year 2: 156 year 3: 184 year 4: 200 year 5: 210 A) Using simple linear regression, the forecast for the number of disk drives to be made next year is.. ___ disk drives (round to one decimal place) B) What is the MSE (Mean Squared Error)? Round to one decimal place C) What is the MAPE...
The number of internal disk drives (in millions) made at a plant in Taiwan during the...
The number of internal disk drives (in millions) made at a plant in Taiwan during the past 5 years follows: Year Disk Drives 1 142 2 156 3 184 4 204 5 210 a) Using simple linear regression, the forecast for the number of disk drives to be made next year = disk drives (round your response to one decimal place). b) The mean squared error (MSE) when using simple linear regression = drives squareddrives2 (round your response to...
The number of internal disk drives (in millions) made at a plant in Taiwan during the...
The number of internal disk drives (in millions) made at a plant in Taiwan during the past 5 years follows: Year Disk Drives 1 140140 2 156156 3 190190 4 202202 5 216216 a) Using simple linear regression..., the forecast for the number of disk drives to be made next year = 240.2 disk drives (round your response to one decimal place). b) The mean squared error (MSE) when using simple linear regression = ????drives^2 (round your response to...
The number of internal disk drives (in milions) made at a plant in Talwan during the...
 The number of internal disk drives (in milions) made at a plant in Talwan during the past 5 years follows: Disk Drives 142 156 196 204 216 Year a) Using simple linear regression, the forecast for the number of disk drives to be made next year disk drives (round your response to one decimal place) b) The mean squared error(MSE) when using simple inear c) The mean absolute percentage error (MAPE) when using simple linear regression . regressiondrives (round your...
Note: Data for these problems are in the Module 2AssistedAssignments Data file –there is a tab...
Note: Data for these problems are in the Module 2AssistedAssignments Data file –there is a tab for each problem.All answers should be entered using two decimal places unless otherwise specified.If both decimal places are zeros –then just enter the integer value. Percentages should be entered without “%” sign -3.45% should be entered as 3.45.M2_A1. The last 20 years of annual sales for a small business is shown in Worksheet P1. The data is shown in $1000s so Year 1 is...
1Year Sales (in $1000s) 283 288 336 388 406 412 416 435 428 435 462 452...
 1Year Sales (in $1000s) 283 288 336 388 406 412 416 435 428 435 462 452 474 476 497 487 523 528 532 552 4 4 6 6 9 10 11 10 12 11 13 12 14 13 1514 16 15 17 16 18 17 19 18 20 19 21 20 23 24 Module 2 Assisted Problems Note: Data for these problems are in the Module 2 Assisted Assignments Data file-there is a tab for each problem. All answers should...
Assume you are analyzing a time series of 12 observations. Using a 3-period moving average, you...
 Assume you are analyzing a time series of 12 observations. Using a 3-period moving average, you successfully calculate the Mean Absolute Error (MAE), Mean Square Error (MSE), and Mean Absolute Percentage Error (MAPE) for each forecasted time period. You then sum the error calculations for each time period for each of the three error calculation techniques respectively. You end up with: MAE 53.5, MSE 547.25, and MAPE 44.15%. To complete your error calculation and compare the accuracy of the 3-period...
The following ANOVA model is for a multiple regression model with two independent variables: Degrees of Sum of Mean Source Freedom Squares ...
 The following ANOVA model is for a multiple regression model
with two independent variables:
Degrees
of
Sum
of
Mean
Source
Freedom
Squares
Squares
F
Regression
2
60
Error
18
120
Total
20
180
Determine the Regression Mean Square (MSR):
Determine the Mean Square Error (MSE):
Compute the overall Fstat test statistic.
Is the Fstat significant at the 0.05 level?
A linear regression was run on auto sales relative to consumer
income. The Regression Sum of Squares (SSR) was 360 and...
The following ANOVA model is for a multiple regression model
with two independent variables:
Degrees
of
Sum
of
Mean
Source
Freedom
Squares
Squares
F
Regression
2
60
Error
18
120
Total
20
180
Determine the Regression Mean Square (MSR):
Determine the Mean Square Error (MSE):
Compute the overall Fstat test statistic.
Is the Fstat significant at the 0.05 level?
A linear regression was run on auto sales relative to consumer
income. The Regression Sum of Squares (SSR) was 360 and...
 The number of internal disk drives (in milions) made at a plant in Talwan during the past 5 years follows: Disk Drives 142 156 196 204 216 Year a) Using simple linear regression, the forecast for the number of disk drives to be made next year disk drives (round your response to one decimal place) b) The mean squared error(MSE) when using simple inear c) The mean absolute percentage error (MAPE) when using simple linear regression . regressiondrives (round your...
 1Year Sales (in $1000s) 283 288 336 388 406 412 416 435 428 435 462 452 474 476 497 487 523 528 532 552 4 4 6 6 9 10 11 10 12 11 13 12 14 13 1514 16 15 17 16 18 17 19 18 20 19 21 20 23 24 Module 2 Assisted Problems Note: Data for these problems are in the Module 2 Assisted Assignments Data file-there is a tab for each problem. All answers should...
 Assume you are analyzing a time series of 12 observations. Using a 3-period moving average, you successfully calculate the Mean Absolute Error (MAE), Mean Square Error (MSE), and Mean Absolute Percentage Error (MAPE) for each forecasted time period. You then sum the error calculations for each time period for each of the three error calculation techniques respectively. You end up with: MAE 53.5, MSE 547.25, and MAPE 44.15%. To complete your error calculation and compare the accuracy of the 3-period...
 The following ANOVA model is for a multiple regression model
with two independent variables:
Degrees
of
Sum
of
Mean
Source
Freedom
Squares
Squares
F
Regression
2
60
Error
18
120
Total
20
180
Determine the Regression Mean Square (MSR):
Determine the Mean Square Error (MSE):
Compute the overall Fstat test statistic.
Is the Fstat significant at the 0.05 level?
A linear regression was run on auto sales relative to consumer
income. The Regression Sum of Squares (SSR) was 360 and...
The following ANOVA model is for a multiple regression model
with two independent variables:
Degrees
of
Sum
of
Mean
Source
Freedom
Squares
Squares
F
Regression
2
60
Error
18
120
Total
20
180
Determine the Regression Mean Square (MSR):
Determine the Mean Square Error (MSE):
Compute the overall Fstat test statistic.
Is the Fstat significant at the 0.05 level?
A linear regression was run on auto sales relative to consumer
income. The Regression Sum of Squares (SSR) was 360 and...
Most questions answered within 3 hours.
-
Where is the error in this code sequence?
String s1 = "Hello";
String s2 = "ello";...
asked 10 months ago -
Financial data for Joel de Paris, Inc., for last year
follow:
Joel de Paris, Inc.
Balance...
asked 10 months ago -
Consider this reaction:
Al2(SO4)3 (aq)+ BaCl3
(aq) Al2Cl6 (aq)- +
3BaSO4(s) . What is the...
asked 10 months ago -
Suppose that Savneet is considering increasing her
recent random sample from 20 car rentals to 40...
asked 10 months ago -
Trucks arrive at an unloading terminal at an average rate of 120
per hour.
Trucks arrive...
asked 10 months ago -
Why are methanol and ethanol completely soluble in water while
octanol is not very little soluble....
asked 10 months ago -
A facilities manager at a university reads in a research report
that the mean amount of...
asked 10 months ago -
When the CuSO4 is rehydrated by adding water to the anhydrous
compound, is this an endothermic...
asked 10 months ago -
A ray of sunlight is passing from diamond into crown glass; the
angle of incidence is...
asked 10 months ago -
A block of mass 0.249 kg is placed on top of a light, vertical
spring of...
asked 10 months ago -
how do the kidneys compensate in the presences of acidosis
a) trigger hyperventilate
b) reserve acid...
asked 10 months ago -
Question 501 pts
The rental rate of capital to the firm increases. Which of the
following...
asked 10 months ago