Q. The following data is a systematic survey of the amount paid by a student at a bookstore for a month. (k = 200, Z0.02...
Homework Answers

Add Answer to:
Q. The following data is a systematic survey of the amount paid by a student at a bookstore for a month. (k = 200, Z0.02...
can you upload the answer in excel 7. Following are ages of 30 students in an...
 can you upload the answer in excel
7. Following are ages of 30 students in an ARC Boot Camp class: 18 30 20 21 28 26 20 21 19 22 26 38 18 19 23 25 19 20 18 21 29 35 17 22 19 24 23 21 20 25 Construct an expanded stem-and-leaf display for the given data. Stem Leaves 2. The following data values are the actual low temperatures recorded near the author's home. Construct a frequency distribution...
can you upload the answer in excel
7. Following are ages of 30 students in an ARC Boot Camp class: 18 30 20 21 28 26 20 21 19 22 26 38 18 19 23 25 19 20 18 21 29 35 17 22 19 24 23 21 20 25 Construct an expanded stem-and-leaf display for the given data. Stem Leaves 2. The following data values are the actual low temperatures recorded near the author's home. Construct a frequency distribution...
The subjects in the data are college students. In the data, id is student ID, anxiety...
The subjects in the data are college students. In the data, id is student ID, anxiety is student’s anxiety score via Anxiety Scale, selfest is student’s self-esteem score via Rosenberg Self-esteem Scale, GPA is student’s GPA; for gender, 0=female, 1=male; for grade, 1=freshman, 2=junior, 3=senior. We have known that population mean for Anxiety Scale is μ=60 with σ=10. Raise relevant questions ( 2 questions is fine) about the data extensively, the questions can be either about descriptive analysis or inferential...
Data were collected on the amount spent by 64 customers for lunch at a major Houston...
 Data were collected on the amount spent by 64 customers for lunch at a major Houston restaurant. These data are contained in the file named Houston. Based upon past studies the population standard deviation is known with = $8. Click on the datafile logo to reference the data. DATA file Round your answers to two decimal places. If needed, use the critical value with three decimal places. a. At 99% confidence, what is the margin of error? b. Develop a...
Consider the following Price Rating Price Rating Price Rating PriceRating 58 13 14 12 19 15...
 Consider the following Price Rating Price Rating Price Rating PriceRating 58 13 14 12 19 15 58 56 59 67 14 17 41 10 54 14 21 62 14 72 12 26 20 26 48 41 17 13 30 24 13 53 51 12 21 19 69 50 78 58 21 50 83 71 25 53 47 63 81 46 12 25 49 38 24 41 19 70 31 23 26 29 79 37 36 49 58 31 25 71...
Student Debt – Vermont (Raw Data, Software Required): The average student loan debt of a U.S....
Student Debt – Vermont (Raw Data, Software Required): The average student loan debt of a U.S. college student at the end of 4 years of college is estimated to be about $22,800. You take a random sample of 40 college students in the state of Vermont. The debt for these students is found in the table below. We want to construct a 90% confidence interval for the mean debt for all Vermont college students. You will need software to answer...
For each variable of interest, do the following: 1. Find the mean, five-number summary, range, variance,...
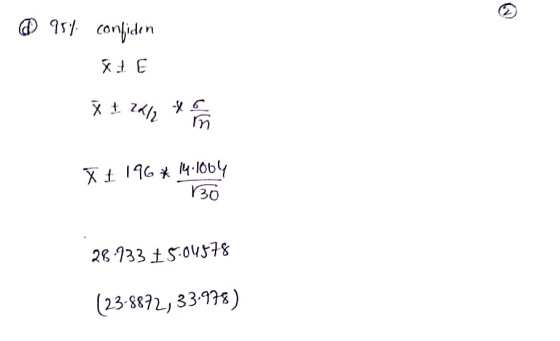
For each variable of interest, do the following: 1. Find the mean, five-number summary, range, variance, and standard deviation. Display these numbers in a format that is easy to understand. 2. For each variable of interest, use its five-number summary to construct a boxplot. Each boxplot must be constructed horizontally, and must be accompanied by a brief descriptive paragraph that assesses whether the data appear to be symmetrical, left-skewed, or right-skewed. Construct a 95% confidence interval for the mean μ...
Suppose a binary tree data (in tiny written size) is stored in an array (A) as...
Suppose a binary tree data (in tiny written size) is stored in an array (A) as given below and root is placed at “0”index. Note the array indices are in larger written size (0 to 74). Show the traversal data of the given tree for a) In-Order Traversal b) Post Order Traversal A 0 1 2 3 4 5 6 7 8 9 10 11 12 13 14 3 28 13 36 15 9 22 44 7 10 75 33 19 15...
For Questions 1-2, use table below. It is data for two stocks over 30 days (it...
For Questions 1-2, use table below. It is data for two stocks over 30 days (it is sample data). Day High stock Sky stock Day High stock Sky stock 1 27 60 16 43 39 2 33 57 17 45 37 3 34 56 18 46 35 4 35 55 19 47 34 5 36 54 20 47 32 6 37 51 21 48 29 7 38 50 22 50 26 8 38 47 23 50 26 9 39 47...
4. The following frequency table shows the test score distribution for a random sample of 25...
 4. The following frequency table shows the test score distribution for a random sample of 25 students taking an introductory statistics class at a certain college. a. Find the missing relative frequency b. How many students in the sample RelativeF 0.08 0.04 Score 30-40 41-51 52-62 63-73 74 -84 85-95 had a score of at least 63? Total number of students taking an introductory statistics class at this college is 800. Based on the sample data above, estimate the total...
Notes: For part i.) Let T= weight of Peterbilt, V= weight of Volkswagen, F= weight of...
 Notes:
For part i.) Let T= weight of Peterbilt,
V= weight of Volkswagen, F= weight of
Ford
"three" Volkswagen means
sample from V not 3V.
For part iii) Use the following table
Vol<sWasen A shipping company has a large fleet of Peterbilt, T trucks. The distribution of weights in lb of these trucks from Peterbilt, Volkswagen and Ford are N(580, 225), N (100,64) and N(120, 81), respectively, and are independent. i. If one Peterbilt truck, three Volkswagen trucks and...
Notes:
For part i.) Let T= weight of Peterbilt,
V= weight of Volkswagen, F= weight of
Ford
"three" Volkswagen means
sample from V not 3V.
For part iii) Use the following table
Vol<sWasen A shipping company has a large fleet of Peterbilt, T trucks. The distribution of weights in lb of these trucks from Peterbilt, Volkswagen and Ford are N(580, 225), N (100,64) and N(120, 81), respectively, and are independent. i. If one Peterbilt truck, three Volkswagen trucks and...
 can you upload the answer in excel
7. Following are ages of 30 students in an ARC Boot Camp class: 18 30 20 21 28 26 20 21 19 22 26 38 18 19 23 25 19 20 18 21 29 35 17 22 19 24 23 21 20 25 Construct an expanded stem-and-leaf display for the given data. Stem Leaves 2. The following data values are the actual low temperatures recorded near the author's home. Construct a frequency distribution...
can you upload the answer in excel
7. Following are ages of 30 students in an ARC Boot Camp class: 18 30 20 21 28 26 20 21 19 22 26 38 18 19 23 25 19 20 18 21 29 35 17 22 19 24 23 21 20 25 Construct an expanded stem-and-leaf display for the given data. Stem Leaves 2. The following data values are the actual low temperatures recorded near the author's home. Construct a frequency distribution...
 Data were collected on the amount spent by 64 customers for lunch at a major Houston restaurant. These data are contained in the file named Houston. Based upon past studies the population standard deviation is known with = $8. Click on the datafile logo to reference the data. DATA file Round your answers to two decimal places. If needed, use the critical value with three decimal places. a. At 99% confidence, what is the margin of error? b. Develop a...
 Consider the following Price Rating Price Rating Price Rating PriceRating 58 13 14 12 19 15 58 56 59 67 14 17 41 10 54 14 21 62 14 72 12 26 20 26 48 41 17 13 30 24 13 53 51 12 21 19 69 50 78 58 21 50 83 71 25 53 47 63 81 46 12 25 49 38 24 41 19 70 31 23 26 29 79 37 36 49 58 31 25 71...
 4. The following frequency table shows the test score distribution for a random sample of 25 students taking an introductory statistics class at a certain college. a. Find the missing relative frequency b. How many students in the sample RelativeF 0.08 0.04 Score 30-40 41-51 52-62 63-73 74 -84 85-95 had a score of at least 63? Total number of students taking an introductory statistics class at this college is 800. Based on the sample data above, estimate the total...
 Notes:
For part i.) Let T= weight of Peterbilt,
V= weight of Volkswagen, F= weight of
Ford
"three" Volkswagen means
sample from V not 3V.
For part iii) Use the following table
Vol<sWasen A shipping company has a large fleet of Peterbilt, T trucks. The distribution of weights in lb of these trucks from Peterbilt, Volkswagen and Ford are N(580, 225), N (100,64) and N(120, 81), respectively, and are independent. i. If one Peterbilt truck, three Volkswagen trucks and...
Notes:
For part i.) Let T= weight of Peterbilt,
V= weight of Volkswagen, F= weight of
Ford
"three" Volkswagen means
sample from V not 3V.
For part iii) Use the following table
Vol<sWasen A shipping company has a large fleet of Peterbilt, T trucks. The distribution of weights in lb of these trucks from Peterbilt, Volkswagen and Ford are N(580, 225), N (100,64) and N(120, 81), respectively, and are independent. i. If one Peterbilt truck, three Volkswagen trucks and...
Most questions answered within 3 hours.
-
Where is the error in this code sequence?
String s1 = "Hello";
String s2 = "ello";...
asked 10 months ago -
Financial data for Joel de Paris, Inc., for last year
follow:
Joel de Paris, Inc.
Balance...
asked 10 months ago -
Consider this reaction:
Al2(SO4)3 (aq)+ BaCl3
(aq) Al2Cl6 (aq)- +
3BaSO4(s) . What is the...
asked 10 months ago -
Suppose that Savneet is considering increasing her
recent random sample from 20 car rentals to 40...
asked 10 months ago -
Trucks arrive at an unloading terminal at an average rate of 120
per hour.
Trucks arrive...
asked 10 months ago -
Why are methanol and ethanol completely soluble in water while
octanol is not very little soluble....
asked 10 months ago -
A facilities manager at a university reads in a research report
that the mean amount of...
asked 10 months ago -
When the CuSO4 is rehydrated by adding water to the anhydrous
compound, is this an endothermic...
asked 10 months ago -
A ray of sunlight is passing from diamond into crown glass; the
angle of incidence is...
asked 10 months ago -
A block of mass 0.249 kg is placed on top of a light, vertical
spring of...
asked 10 months ago -
how do the kidneys compensate in the presences of acidosis
a) trigger hyperventilate
b) reserve acid...
asked 10 months ago -
Question 501 pts
The rental rate of capital to the firm increases. Which of the
following...
asked 10 months ago