
Homework Answers
Add Answer to:
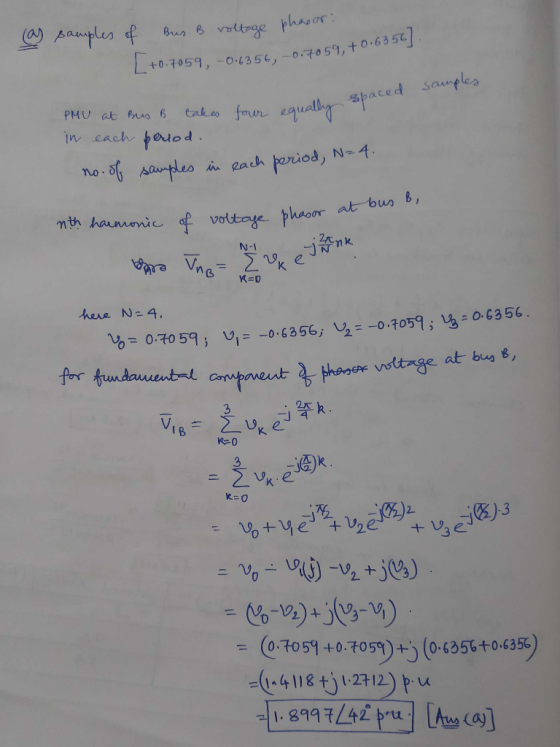
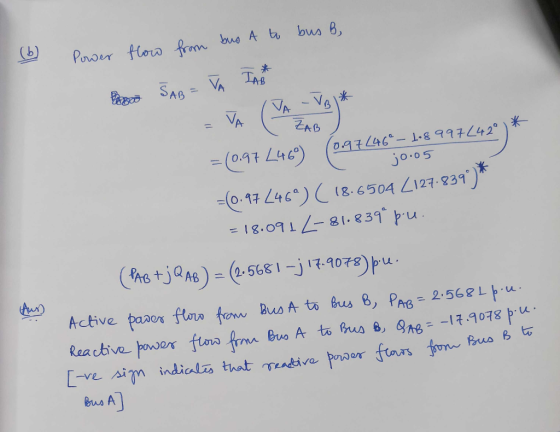
A two bus segment that is part of a larger power network is shown in figure 3. The reactance of the line connecting the...
The single line diagram of a power network is shown in the figure. Bus#1 is a slack bus. The sche...
 The single line diagram of a power network is shown in the figure. Bus#1 is a slack bus. The scheduled powers for bus#2 and bus#3 are given. The impedances shown in the figure are all in per-unit considering a power base of 100 MVA. 30 400 MW 320 MVAr Slack V-1400.0125 jo.os 3 300 MW 270 MVAr A. Use the Gauss Seidel technique to determine voltages at bus#2 & bus#3. (Start with an initial guess 140 for both buses). [Only...
The single line diagram of a power network is shown in the figure. Bus#1 is a slack bus. The sche...
 Answer part D
The single line diagram of a power network is shown in the figure. Bus#1 is a slack bus. The scheduled powers for bus#2 and bus#3 are given. The impedances shown in the figure are all in per-unit considering a power base of 100 MVA. 30 400 MW 320 MVAr Slack V-140 j0.0125 jo.0s 00 MW 270 MVAr A. Use the Gauss Seidel technique to determine voltages at bus#2 & bus#3. (Start with an initial guess 140 for...
Answer part D
The single line diagram of a power network is shown in the figure. Bus#1 is a slack bus. The scheduled powers for bus#2 and bus#3 are given. The impedances shown in the figure are all in per-unit considering a power base of 100 MVA. 30 400 MW 320 MVAr Slack V-140 j0.0125 jo.0s 00 MW 270 MVAr A. Use the Gauss Seidel technique to determine voltages at bus#2 & bus#3. (Start with an initial guess 140 for...
The one-line diagram of a three-bus power system is shown in Figure 4. All impedances are...
 The one-line diagram of a three-bus power system is shown in
Figure 4. All impedances are
expressed in per unit on a common MVA base. All resistances and
shunt capacitances are
neglected. Information on each component in this system is given
below:
• Each generator is represented by an emf
behind the sub-transient reactance of j0.045
and their neutrals are connected to the
ground.
• Line 1-2 has reactance of j0.88
• Line 2-3 has reactance of j0.65
• Line...
The one-line diagram of a three-bus power system is shown in
Figure 4. All impedances are
expressed in per unit on a common MVA base. All resistances and
shunt capacitances are
neglected. Information on each component in this system is given
below:
• Each generator is represented by an emf
behind the sub-transient reactance of j0.045
and their neutrals are connected to the
ground.
• Line 1-2 has reactance of j0.88
• Line 2-3 has reactance of j0.65
• Line...
Q2. i) The one-line diagram of simple three-bus power system with generation at bus 1 is shown in figure Q2. 0.02 + 30.04 2 256.6 MW 0.0125 + 30.025 +110.2 Mvar 0.01 + 30.03 Slack Bus 3 Vi = 1.0520° 138.6 MW 45.2 Mvar Figure Q2 The magnitude of voltage at
Q2. i) The one-line diagram of simple three-bus power system with generation at bus 1 is shown in figure Q2. 0.02 + 30.04 2 256.6 MW 0.0125 + 30.025 +110.2 Mvar 0.01 + 30.03 Slack Bus 3 Vi = 1.0520° 138.6 MW 45.2 Mvar Figure Q2 The magnitude of voltage at bus 1 is adjusted to 1.05 per unit. The scheduled loads at buses 2 and 3 are as marked on the diagram. Line impedances are marked in per unit...
Consider the single line diagram of a 3-bus power system shown in Figure 2. Slack bus...
 Consider the single line diagram of a 3-bus power system shown in Figure 2. Slack bus 3 Figure 2. The data for this system are given in Tables 1 and 2. Bus Table 1 Generation Load Assumed PG QGPLQL bus voltage (MW) (MVar) (MW) (MVar) 1.05 +10.0 - - 1.0 + 0.0 50 30 305.6 140.2 1.0 +0.0 0.0 0.0 138.6 45.2 slack bus) Table 2 Bus-to-bus Impedance 0.2 + j0.04 .01 +0.03 2.3 0.0125 + j0.025 (0) Convert all...
#1(i) For the one line 3-phse power system shown in Fig.1, show that the real power,...
 #1(i) For the one line 3-phse power system shown in Fig.1, show that the real power, P in per unit, delivered to bus-2 by the generator, is P = (I Egl IVrl sin δ)/(Xg + Xr), where Eg, is the generated voltage of the alternator in per unit and Xg its synchronous reactance in per unit, V, is the bus-2 voltage at the receiving end of the transmission line with reactance x, all in per unit, and δ is the...
1. In the power system network shown in Figure 1, Vi bus 1 is a slack bus with 1.00 per unit and bus 2 is a load bus wi...
 1. In the power system network shown in Figure 1, Vi bus 1 is a slack bus with 1.00 per unit and bus 2 is a load bus with S2 Mvar. The line impedance on a base of 100 MVA is Z = 0.02 + j0.04 per unit (a) Using Gauss-Seidel method, determine V2 . Use an initial estimate of V=1.0j0.0 and perform four iterations (b) If after several iterations voltage at bus 2 converges to V2 = 0.90-j0.10, determine...
A synchronous generator is connected to an infinite bus via a transformer and a network of...
 A synchronous generator is connected to an infinite bus via a transformer and a network of transmission lines, as illustrated in Figure 1 below. Per unit reactances for all elements are shown to a common system base. The generator is delivering 1.1 per unit real power to the infinite bus, and the infinite bus voltage is regulated to 1.05 per unit. The excitation voltage of the synchronous generator is set to 1.30 per unit. The inertia constant of the generator...
3. Figure 3, shows the one-line diagram of a simple three-bus power system with generation at buses 1 and 3. The voltag...
 Figure 3, shows the one-line diagram of a simple three-bus power system with generation at buses 1 and 3 . The voltage at bus 1 is \(V_{1}=1.025 \angle 0^{\circ}\) per unit. Voltage magnitude at bus 3 is fixed at \(1.03\) pu with a real power generation of \(300 \mathrm{MW}\). A load consisting of \(400 \mathrm{MW}\) and \(200 \mathrm{Mvar}\) is taken from bus 2. Line impedances are marked in per unit on a 100-MVA base. For the purpose of hand calculations,...
5 in the 3-bus power system, what reactive power compensation needs to be provided at bus-3...
 5 in the 3-bus power system, what reactive power compensation
needs to be provided at bus-3 to bring its voltage to 1
pu.
To illustrate power flow calculations, an extremely simple power system consisting of three buses is shown in Figure 5.1. These three buses are connected through three 345-kV transmission lines 200 km, 150 km, and 150 km long, as shown in Figure 5.1. Similar to the values listed in Table 4-1 of Chapter 4, assume that these transmission...
5 in the 3-bus power system, what reactive power compensation
needs to be provided at bus-3 to bring its voltage to 1
pu.
To illustrate power flow calculations, an extremely simple power system consisting of three buses is shown in Figure 5.1. These three buses are connected through three 345-kV transmission lines 200 km, 150 km, and 150 km long, as shown in Figure 5.1. Similar to the values listed in Table 4-1 of Chapter 4, assume that these transmission...
 The single line diagram of a power network is shown in the figure. Bus#1 is a slack bus. The scheduled powers for bus#2 and bus#3 are given. The impedances shown in the figure are all in per-unit considering a power base of 100 MVA. 30 400 MW 320 MVAr Slack V-1400.0125 jo.os 3 300 MW 270 MVAr A. Use the Gauss Seidel technique to determine voltages at bus#2 & bus#3. (Start with an initial guess 140 for both buses). [Only...
 Answer part D
The single line diagram of a power network is shown in the figure. Bus#1 is a slack bus. The scheduled powers for bus#2 and bus#3 are given. The impedances shown in the figure are all in per-unit considering a power base of 100 MVA. 30 400 MW 320 MVAr Slack V-140 j0.0125 jo.0s 00 MW 270 MVAr A. Use the Gauss Seidel technique to determine voltages at bus#2 & bus#3. (Start with an initial guess 140 for...
Answer part D
The single line diagram of a power network is shown in the figure. Bus#1 is a slack bus. The scheduled powers for bus#2 and bus#3 are given. The impedances shown in the figure are all in per-unit considering a power base of 100 MVA. 30 400 MW 320 MVAr Slack V-140 j0.0125 jo.0s 00 MW 270 MVAr A. Use the Gauss Seidel technique to determine voltages at bus#2 & bus#3. (Start with an initial guess 140 for...
 The one-line diagram of a three-bus power system is shown in
Figure 4. All impedances are
expressed in per unit on a common MVA base. All resistances and
shunt capacitances are
neglected. Information on each component in this system is given
below:
• Each generator is represented by an emf
behind the sub-transient reactance of j0.045
and their neutrals are connected to the
ground.
• Line 1-2 has reactance of j0.88
• Line 2-3 has reactance of j0.65
• Line...
The one-line diagram of a three-bus power system is shown in
Figure 4. All impedances are
expressed in per unit on a common MVA base. All resistances and
shunt capacitances are
neglected. Information on each component in this system is given
below:
• Each generator is represented by an emf
behind the sub-transient reactance of j0.045
and their neutrals are connected to the
ground.
• Line 1-2 has reactance of j0.88
• Line 2-3 has reactance of j0.65
• Line...
 Consider the single line diagram of a 3-bus power system shown in Figure 2. Slack bus 3 Figure 2. The data for this system are given in Tables 1 and 2. Bus Table 1 Generation Load Assumed PG QGPLQL bus voltage (MW) (MVar) (MW) (MVar) 1.05 +10.0 - - 1.0 + 0.0 50 30 305.6 140.2 1.0 +0.0 0.0 0.0 138.6 45.2 slack bus) Table 2 Bus-to-bus Impedance 0.2 + j0.04 .01 +0.03 2.3 0.0125 + j0.025 (0) Convert all...
 #1(i) For the one line 3-phse power system shown in Fig.1, show that the real power, P in per unit, delivered to bus-2 by the generator, is P = (I Egl IVrl sin δ)/(Xg + Xr), where Eg, is the generated voltage of the alternator in per unit and Xg its synchronous reactance in per unit, V, is the bus-2 voltage at the receiving end of the transmission line with reactance x, all in per unit, and δ is the...
 1. In the power system network shown in Figure 1, Vi bus 1 is a slack bus with 1.00 per unit and bus 2 is a load bus with S2 Mvar. The line impedance on a base of 100 MVA is Z = 0.02 + j0.04 per unit (a) Using Gauss-Seidel method, determine V2 . Use an initial estimate of V=1.0j0.0 and perform four iterations (b) If after several iterations voltage at bus 2 converges to V2 = 0.90-j0.10, determine...
 A synchronous generator is connected to an infinite bus via a transformer and a network of transmission lines, as illustrated in Figure 1 below. Per unit reactances for all elements are shown to a common system base. The generator is delivering 1.1 per unit real power to the infinite bus, and the infinite bus voltage is regulated to 1.05 per unit. The excitation voltage of the synchronous generator is set to 1.30 per unit. The inertia constant of the generator...
 Figure 3, shows the one-line diagram of a simple three-bus power system with generation at buses 1 and 3 . The voltage at bus 1 is \(V_{1}=1.025 \angle 0^{\circ}\) per unit. Voltage magnitude at bus 3 is fixed at \(1.03\) pu with a real power generation of \(300 \mathrm{MW}\). A load consisting of \(400 \mathrm{MW}\) and \(200 \mathrm{Mvar}\) is taken from bus 2. Line impedances are marked in per unit on a 100-MVA base. For the purpose of hand calculations,...
 5 in the 3-bus power system, what reactive power compensation
needs to be provided at bus-3 to bring its voltage to 1
pu.
To illustrate power flow calculations, an extremely simple power system consisting of three buses is shown in Figure 5.1. These three buses are connected through three 345-kV transmission lines 200 km, 150 km, and 150 km long, as shown in Figure 5.1. Similar to the values listed in Table 4-1 of Chapter 4, assume that these transmission...
5 in the 3-bus power system, what reactive power compensation
needs to be provided at bus-3 to bring its voltage to 1
pu.
To illustrate power flow calculations, an extremely simple power system consisting of three buses is shown in Figure 5.1. These three buses are connected through three 345-kV transmission lines 200 km, 150 km, and 150 km long, as shown in Figure 5.1. Similar to the values listed in Table 4-1 of Chapter 4, assume that these transmission...
Most questions answered within 3 hours.
-
Where is the error in this code sequence?
String s1 = "Hello";
String s2 = "ello";...
asked 11 months ago -
Financial data for Joel de Paris, Inc., for last year
follow:
Joel de Paris, Inc.
Balance...
asked 11 months ago -
Consider this reaction:
Al2(SO4)3 (aq)+ BaCl3
(aq) Al2Cl6 (aq)- +
3BaSO4(s) . What is the...
asked 11 months ago -
Suppose that Savneet is considering increasing her
recent random sample from 20 car rentals to 40...
asked 11 months ago -
Trucks arrive at an unloading terminal at an average rate of 120
per hour.
Trucks arrive...
asked 11 months ago -
Why are methanol and ethanol completely soluble in water while
octanol is not very little soluble....
asked 11 months ago -
A facilities manager at a university reads in a research report
that the mean amount of...
asked 11 months ago -
When the CuSO4 is rehydrated by adding water to the anhydrous
compound, is this an endothermic...
asked 11 months ago -
A ray of sunlight is passing from diamond into crown glass; the
angle of incidence is...
asked 11 months ago -
A block of mass 0.249 kg is placed on top of a light, vertical
spring of...
asked 11 months ago -
how do the kidneys compensate in the presences of acidosis
a) trigger hyperventilate
b) reserve acid...
asked 11 months ago -
Question 501 pts
The rental rate of capital to the firm increases. Which of the
following...
asked 11 months ago