If Sally is a vegetarian, what would her indifference curve of hamburgers and vegetarian pasta look like? Please explai...
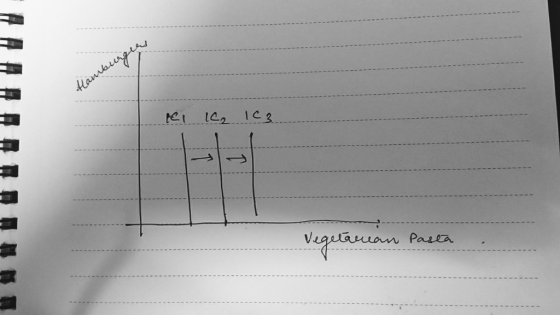
If Sally is a vegetarian, what would her indifference curve of hamburgers and vegetarian pasta look like? Please explain, draw and label the graph.
Homework Answers
The person does not consumer hamburgers at all and only consumes vegetarian pasta.The indifference curve will be vertical showing no conaumpcons of hamburgers.
Add Answer to:
If Sally is a vegetarian, what would her indifference curve of
hamburgers and vegetarian pasta look like? Please explai...
Sally Consumer's indifference curve between cigarettes and hamburgers is upward sloping. Based on this information, can...
Sally Consumer's indifference curve between cigarettes and hamburgers is upward sloping. Based on this information, can we conclude that Sally views cigarettes as "bads" and hamburgers as "goods"? Explain.
Suppose that Jessica has income Y and has preferences over hamburgers and movie tickets. Her budget...
Suppose that Jessica has income Y and has preferences over hamburgers and movie tickets. Her budget constraint is: Y = Ph*h+Pm*m. Where Ph and Pm denote the price of hamburgers and movie tickets and h and m their quantity. Assume that Jessica's income is equal to $400 and that each hamburger costs $4 and each ticket costs $8. Draw the budget constraint as well as an indifference curve that satisfies the condition for utility maximization. Please fully label the graph....
please answer all questions 2. Draw the graph of an indifference curve map for the utility...
 please answer all questions
2. Draw the graph of an indifference curve map for the utility function U(X,Y)= XY. Put good X on X-axis and good Y on Y-axis. Draw at least 3 indifference curves and label the utility level for each indifference curve. Explain why or why not do the indifference curves cross each other on the map.
please answer all questions
2. Draw the graph of an indifference curve map for the utility function U(X,Y)= XY. Put good X on X-axis and good Y on Y-axis. Draw at least 3 indifference curves and label the utility level for each indifference curve. Explain why or why not do the indifference curves cross each other on the map.
Sketch what a titration curve would look like? 1. Consider the titration of 50.00 mL of...
 Sketch what a titration curve would look like?
1. Consider the titration of 50.00 mL of 0.01550 M NH3 with 0.03720 M HNO3. A. Sketch what a titration curve would look like for this titration, making sure to: Label both axes Illustrate a curve with the appropriate shape Indicate the location of the equivalence point on the curve (you do not need to identify its exact location on the axes) alenrennint in this titration, the titrated solution will have a...
Sketch what a titration curve would look like?
1. Consider the titration of 50.00 mL of 0.01550 M NH3 with 0.03720 M HNO3. A. Sketch what a titration curve would look like for this titration, making sure to: Label both axes Illustrate a curve with the appropriate shape Indicate the location of the equivalence point on the curve (you do not need to identify its exact location on the axes) alenrennint in this titration, the titrated solution will have a...
4. Draw what the sample of water would look like on the molecular level at 110°C....
 4. Draw what the sample of water would look like on the molecular level at 110°C. (Be sure to draw and label the strongest interaction present as well as explain your drawing if needed) 5. Draw what the sample of water would look like on the molecular level at 100°C, the phase change. (Be sure to draw and label the strongest interaction present as well as explain your drawing if needed) 6. What interactions and/or bonds are overcome at 0°C?...
What happens to the market demand for McDonald’s hamburgers when ______? -McDonald’s reduces the price of...
What happens to the market demand for McDonald’s hamburgers when ______? -McDonald’s reduces the price of its hamburgers, while the price of Burger King’s hamburgers remains unchanged The question presents a change in the demand environment for McDonald’s hamburgers. The assumption of "ceteris paribus" (other things being equal) is made in each case. For each question, you should begin by drawing a typical market demand curve for McDonald’s hamburgers. For each question, you must both explain your answer verbally and...
What is an indifference curve and how does a preference map show preferences? Peaches (number per month) An indifferenc...
 What is an indifference curve and how does a preference map show preferences? Peaches (number per month) An indifference curve shows_ . A preference map shows that a person prefers combinations A combinations of goods that a consumer can afford; he cannot afford over the combinations he can afford O B. combinations of goods that are available; on lower indifference curves to combinations on higher indifference curves O C. combinations of goods among which a consumer is indifferent; that are...
What happens to the market demand for McDonald’s hamburgers when ______? Burger King increases the price...
What happens to the market demand for McDonald’s hamburgers when ______? Burger King increases the price of its hamburgers, while the price of McDonald’s hamburgers is unchanged. The question is presenting a change in the demand environment for McDonald’s hamburgers. The assumption of "ceteris paribus" (other things being equal) is made in each case. You should begin by drawing a typical market demand curve for McDonald’s hamburgers. You must both explain your answer verbally and illustrate your answer graphically. Label...
Jane commutes to work. She can either use public transport or her own car. Her indifference curve...
 Jane commutes to work. She can either use public transport or her own car. Her indifference curves obey the four properties of indifference curves for ordinary goods 1. Draw Jane's budget line (BL,) with car travel on the vertical axis and public transport on the horizontal axis 2. Suppose that Jane consumes some of both goods. Explain how her optimal consumption bundle can be obtained. Then, draw an indifference curve that helps you illustrate that optimal consumption bundle represented by...
Define an indifference curve and on a correctly labeled graph explain what the points along the...
Define an indifference curve and on a correctly labeled graph explain what the points along the indifference curve represent. Define using the correct mathematical equations for: a) a budget set, and b) a budget line. On correctly labeled graph, show and explain the indifference curves for normal goods X and Y. In two sentences, define a budget line.
 please answer all questions
2. Draw the graph of an indifference curve map for the utility function U(X,Y)= XY. Put good X on X-axis and good Y on Y-axis. Draw at least 3 indifference curves and label the utility level for each indifference curve. Explain why or why not do the indifference curves cross each other on the map.
please answer all questions
2. Draw the graph of an indifference curve map for the utility function U(X,Y)= XY. Put good X on X-axis and good Y on Y-axis. Draw at least 3 indifference curves and label the utility level for each indifference curve. Explain why or why not do the indifference curves cross each other on the map.
 Sketch what a titration curve would look like?
1. Consider the titration of 50.00 mL of 0.01550 M NH3 with 0.03720 M HNO3. A. Sketch what a titration curve would look like for this titration, making sure to: Label both axes Illustrate a curve with the appropriate shape Indicate the location of the equivalence point on the curve (you do not need to identify its exact location on the axes) alenrennint in this titration, the titrated solution will have a...
Sketch what a titration curve would look like?
1. Consider the titration of 50.00 mL of 0.01550 M NH3 with 0.03720 M HNO3. A. Sketch what a titration curve would look like for this titration, making sure to: Label both axes Illustrate a curve with the appropriate shape Indicate the location of the equivalence point on the curve (you do not need to identify its exact location on the axes) alenrennint in this titration, the titrated solution will have a...
 4. Draw what the sample of water would look like on the molecular level at 110°C. (Be sure to draw and label the strongest interaction present as well as explain your drawing if needed) 5. Draw what the sample of water would look like on the molecular level at 100°C, the phase change. (Be sure to draw and label the strongest interaction present as well as explain your drawing if needed) 6. What interactions and/or bonds are overcome at 0°C?...
 What is an indifference curve and how does a preference map show preferences? Peaches (number per month) An indifference curve shows_ . A preference map shows that a person prefers combinations A combinations of goods that a consumer can afford; he cannot afford over the combinations he can afford O B. combinations of goods that are available; on lower indifference curves to combinations on higher indifference curves O C. combinations of goods among which a consumer is indifferent; that are...
 Jane commutes to work. She can either use public transport or her own car. Her indifference curves obey the four properties of indifference curves for ordinary goods 1. Draw Jane's budget line (BL,) with car travel on the vertical axis and public transport on the horizontal axis 2. Suppose that Jane consumes some of both goods. Explain how her optimal consumption bundle can be obtained. Then, draw an indifference curve that helps you illustrate that optimal consumption bundle represented by...
Most questions answered within 3 hours.
-
Where is the error in this code sequence?
String s1 = "Hello";
String s2 = "ello";...
asked 10 months ago -
Financial data for Joel de Paris, Inc., for last year
follow:
Joel de Paris, Inc.
Balance...
asked 10 months ago -
Consider this reaction:
Al2(SO4)3 (aq)+ BaCl3
(aq) Al2Cl6 (aq)- +
3BaSO4(s) . What is the...
asked 10 months ago -
Suppose that Savneet is considering increasing her
recent random sample from 20 car rentals to 40...
asked 10 months ago -
Trucks arrive at an unloading terminal at an average rate of 120
per hour.
Trucks arrive...
asked 10 months ago -
Why are methanol and ethanol completely soluble in water while
octanol is not very little soluble....
asked 10 months ago -
A facilities manager at a university reads in a research report
that the mean amount of...
asked 10 months ago -
When the CuSO4 is rehydrated by adding water to the anhydrous
compound, is this an endothermic...
asked 10 months ago -
A ray of sunlight is passing from diamond into crown glass; the
angle of incidence is...
asked 10 months ago -
A block of mass 0.249 kg is placed on top of a light, vertical
spring of...
asked 10 months ago -
how do the kidneys compensate in the presences of acidosis
a) trigger hyperventilate
b) reserve acid...
asked 10 months ago -
Question 501 pts
The rental rate of capital to the firm increases. Which of the
following...
asked 10 months ago