
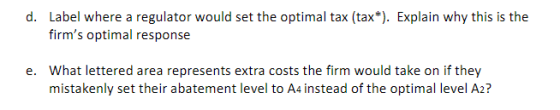
d. Label where a regulator would set the optimal tax (tax*). Explain why this is the firm's optimal response What lettered area represents extra costs the firm would take on if they mistakenly set their abatement level to A4 instead of the optimal level A2? e.
Homework Answers


Add Answer to:
6. Answer the following questions using the graph below: МАС W Z M МB A A2...
The graph below shows a market for house-painting services. Use it to answer the questions that...
 The graph below shows a market for house-painting
services. Use it to answer the questions that follow.
A)Painting the exterior of your house yields external
benefits for your neighbors. Label the private benefit and social
benefit curves and show the amount of the external
benefit.
B)What is the equilibrium price and
quantity?
C)What is the socially optimal quantity in this
market?
(d) Does the market produce too much or too little of
this good relative to the socially optimal outcome?...
The graph below shows a market for house-painting
services. Use it to answer the questions that follow.
A)Painting the exterior of your house yields external
benefits for your neighbors. Label the private benefit and social
benefit curves and show the amount of the external
benefit.
B)What is the equilibrium price and
quantity?
C)What is the socially optimal quantity in this
market?
(d) Does the market produce too much or too little of
this good relative to the socially optimal outcome?...
(4) The graph below shows a market for house-painting services. Use it to answer the questions...
 (4) The graph below shows a market for house-painting services. Use it to answer the questions that follow. Price of house painting Supply $2.200 $1,800 $1,600 Demand 110 140 Quantity of houses painted (in thousands) (a) Painting the exterior of your house yields external benefits for your neighbors. Label the private benefit and social benefit curves and show the amount of the external benefit. (b) What is the equilibrium price and quantity? c) What is the socially optimal quantity in...
Problem Set 2. Market Failure: Externalities and Common Pool Resources EconS 326 1. Cigarette production requires...
 Problem Set 2. Market Failure: Externalities and Common Pool Resources EconS 326 1. Cigarette production requires use of energy, water and other resources. When planting tobacco leaves, fertilizer is used that creates runoff and water pollution in waterways. Tobacco smoke pollutes indoor and outdoor environments and remains a pervasive and persistent source of toxicants long after the cigarette is extinguished. a. Is there too little, too much or the correct amount of cigarette produced or consumed from a socially optimal...
what are the answers to these questions? Use the graph below to answer que stions 1-5....
 what are the answers to these questions?
Use the graph below to answer que stions 1-5. It represents the market for the monthly U.S. beer market, a delicious product which nonetheless produces one of the largest negative externalities among popular goods Ssocial Sprivate 10 15 20 25 30 35 4045 50 55 60 65 0 5 Qin millions 1. What is the implied amount of the marginal damage in the above graph? 2. At what price is the socially optimal...
what are the answers to these questions?
Use the graph below to answer que stions 1-5. It represents the market for the monthly U.S. beer market, a delicious product which nonetheless produces one of the largest negative externalities among popular goods Ssocial Sprivate 10 15 20 25 30 35 4045 50 55 60 65 0 5 Qin millions 1. What is the implied amount of the marginal damage in the above graph? 2. At what price is the socially optimal...
what are the answers to these questions? Use the graph below to answer questions 5-10. It...
 what are the answers to these questions?
Use the graph below to answer questions 5-10. It represents the market for flu-shots, a good that produces a sizable positive externality, | 55 52.5 ។ 50 47.5 45 ។ 42.5 | | 40 37.5 351 32.5 ។ ង 30 | E. 27.5 ។ 25 22.5 + 20 ។ 17.5 ។ 15 12.5 D social 9 2.5 ។ | 0 5 10 15 20 25 30 35 40 45 50 55 60 65...
what are the answers to these questions?
Use the graph below to answer questions 5-10. It represents the market for flu-shots, a good that produces a sizable positive externality, | 55 52.5 ។ 50 47.5 45 ។ 42.5 | | 40 37.5 351 32.5 ។ ង 30 | E. 27.5 ។ 25 22.5 + 20 ។ 17.5 ។ 15 12.5 D social 9 2.5 ។ | 0 5 10 15 20 25 30 35 40 45 50 55 60 65...
10. (8 points) Consider the following graph depicting the competitive market for oil. Price of Oil...
 10. (8 points) Consider the following graph depicting the competitive market for oil. Price of Oil ($) Demand - - Supply ***** Social Cost 0 1 10 11 2 3 4 5 6 7 8 9 Quantity Oil (millions of barrels) a. In a free market with no restrictions, what is the equilibrium quantity and price of oil? b. Why does the above graph indicate that there is an externality associated with producing oil? What is the value of the...
The graph is below. 6. Refer to Figure 15-6. What area measures the monopolist’s profit? (K-C)*W (L-A)*T (K-B)*W 0.5[(K-C)*(Z-T)] download?verifier=kMtVtwZuG9vNA64o3Itl3r 20. Scenario 15-3 A monopoly firm maximizes its profit by producing Q = 500
 The graph is below.6.Refer to Figure 15-6. What area measures the
monopolist’s profit?(K-C)*W(L-A)*T(K-B)*W0.5[(K-C)*(Z-T)]20.Scenario 15-3A monopoly firm maximizes its profit by producing Q = 500 units of
output. At that level of output, its marginal revenue is $30, its
average revenue is $60, and its average total cost is $34.Refer to Scenario 15-3. At Q = 500, the firm's
profit is-$13,000.-$15,000.-$17,000.-$30,000.21.21. Refer to Figure 15-9. To maximize total
surplus, a benevolent social planner would choose which of the
following outcomes?-100 units...
The graph is below.6.Refer to Figure 15-6. What area measures the
monopolist’s profit?(K-C)*W(L-A)*T(K-B)*W0.5[(K-C)*(Z-T)]20.Scenario 15-3A monopoly firm maximizes its profit by producing Q = 500 units of
output. At that level of output, its marginal revenue is $30, its
average revenue is $60, and its average total cost is $34.Refer to Scenario 15-3. At Q = 500, the firm's
profit is-$13,000.-$15,000.-$17,000.-$30,000.21.21. Refer to Figure 15-9. To maximize total
surplus, a benevolent social planner would choose which of the
following outcomes?-100 units...
This problem asks you to analyze environmental quality as a public good, but using a slightly...
This problem asks you to analyze environmental quality as a public good, but using a slightly different approach than was used in the class example. In class we measured environmental quality by the percent abated (20%, 60% etc), this time we will measure environmental quality in terms of the quantity of pollution abated. I ask you to go into some detail about your calculations, to illustrate your understanding intuitively and technically. The Valley of Grimes is inhabited by three people...
CHAPTER 23 – ASSIGNMENT #1 Answer the following questions using the graph shown below. Assume that...
 CHAPTER 23 – ASSIGNMENT #1 Answer the following questions using
the graph shown below. Assume that the firm is producing the number
of units that will maximize their profit in a perfectly competitive
market. You can use the explanatory for problem 23-3 that are in
the Handouts on the main page of your course website to aid you in
the completion of this problem. The D curve in this problem is the
same as the MR curve. ? • How...
CHAPTER 23 – ASSIGNMENT #1 Answer the following questions using
the graph shown below. Assume that the firm is producing the number
of units that will maximize their profit in a perfectly competitive
market. You can use the explanatory for problem 23-3 that are in
the Handouts on the main page of your course website to aid you in
the completion of this problem. The D curve in this problem is the
same as the MR curve. ? • How...
Question 4-(Chapter 6)- Government Policies: Using the graph shown, answer the following questions: a. What was...
 Question 4-(Chapter 6)- Government Policies: Using the graph shown, answer the following questions: a. What was the equilibrium price in this market before the tax? b. What is the amount of the tax? c. How much of the tax will the buyers pay? d. How much of the tax wil the sellers pay? e. How much will the buyer pay for the product after the tax is imposed? f. How much will the seller receive after the tax is imposed?...
 The graph below shows a market for house-painting
services. Use it to answer the questions that follow.
A)Painting the exterior of your house yields external
benefits for your neighbors. Label the private benefit and social
benefit curves and show the amount of the external
benefit.
B)What is the equilibrium price and
quantity?
C)What is the socially optimal quantity in this
market?
(d) Does the market produce too much or too little of
this good relative to the socially optimal outcome?...
The graph below shows a market for house-painting
services. Use it to answer the questions that follow.
A)Painting the exterior of your house yields external
benefits for your neighbors. Label the private benefit and social
benefit curves and show the amount of the external
benefit.
B)What is the equilibrium price and
quantity?
C)What is the socially optimal quantity in this
market?
(d) Does the market produce too much or too little of
this good relative to the socially optimal outcome?...
 (4) The graph below shows a market for house-painting services. Use it to answer the questions that follow. Price of house painting Supply $2.200 $1,800 $1,600 Demand 110 140 Quantity of houses painted (in thousands) (a) Painting the exterior of your house yields external benefits for your neighbors. Label the private benefit and social benefit curves and show the amount of the external benefit. (b) What is the equilibrium price and quantity? c) What is the socially optimal quantity in...
 Problem Set 2. Market Failure: Externalities and Common Pool Resources EconS 326 1. Cigarette production requires use of energy, water and other resources. When planting tobacco leaves, fertilizer is used that creates runoff and water pollution in waterways. Tobacco smoke pollutes indoor and outdoor environments and remains a pervasive and persistent source of toxicants long after the cigarette is extinguished. a. Is there too little, too much or the correct amount of cigarette produced or consumed from a socially optimal...
 what are the answers to these questions?
Use the graph below to answer que stions 1-5. It represents the market for the monthly U.S. beer market, a delicious product which nonetheless produces one of the largest negative externalities among popular goods Ssocial Sprivate 10 15 20 25 30 35 4045 50 55 60 65 0 5 Qin millions 1. What is the implied amount of the marginal damage in the above graph? 2. At what price is the socially optimal...
what are the answers to these questions?
Use the graph below to answer que stions 1-5. It represents the market for the monthly U.S. beer market, a delicious product which nonetheless produces one of the largest negative externalities among popular goods Ssocial Sprivate 10 15 20 25 30 35 4045 50 55 60 65 0 5 Qin millions 1. What is the implied amount of the marginal damage in the above graph? 2. At what price is the socially optimal...
 what are the answers to these questions?
Use the graph below to answer questions 5-10. It represents the market for flu-shots, a good that produces a sizable positive externality, | 55 52.5 ។ 50 47.5 45 ។ 42.5 | | 40 37.5 351 32.5 ។ ង 30 | E. 27.5 ។ 25 22.5 + 20 ។ 17.5 ។ 15 12.5 D social 9 2.5 ។ | 0 5 10 15 20 25 30 35 40 45 50 55 60 65...
what are the answers to these questions?
Use the graph below to answer questions 5-10. It represents the market for flu-shots, a good that produces a sizable positive externality, | 55 52.5 ។ 50 47.5 45 ។ 42.5 | | 40 37.5 351 32.5 ។ ង 30 | E. 27.5 ។ 25 22.5 + 20 ។ 17.5 ។ 15 12.5 D social 9 2.5 ។ | 0 5 10 15 20 25 30 35 40 45 50 55 60 65...
 10. (8 points) Consider the following graph depicting the competitive market for oil. Price of Oil ($) Demand - - Supply ***** Social Cost 0 1 10 11 2 3 4 5 6 7 8 9 Quantity Oil (millions of barrels) a. In a free market with no restrictions, what is the equilibrium quantity and price of oil? b. Why does the above graph indicate that there is an externality associated with producing oil? What is the value of the...
 The graph is below.6.Refer to Figure 15-6. What area measures the
monopolist’s profit?(K-C)*W(L-A)*T(K-B)*W0.5[(K-C)*(Z-T)]20.Scenario 15-3A monopoly firm maximizes its profit by producing Q = 500 units of
output. At that level of output, its marginal revenue is $30, its
average revenue is $60, and its average total cost is $34.Refer to Scenario 15-3. At Q = 500, the firm's
profit is-$13,000.-$15,000.-$17,000.-$30,000.21.21. Refer to Figure 15-9. To maximize total
surplus, a benevolent social planner would choose which of the
following outcomes?-100 units...
The graph is below.6.Refer to Figure 15-6. What area measures the
monopolist’s profit?(K-C)*W(L-A)*T(K-B)*W0.5[(K-C)*(Z-T)]20.Scenario 15-3A monopoly firm maximizes its profit by producing Q = 500 units of
output. At that level of output, its marginal revenue is $30, its
average revenue is $60, and its average total cost is $34.Refer to Scenario 15-3. At Q = 500, the firm's
profit is-$13,000.-$15,000.-$17,000.-$30,000.21.21. Refer to Figure 15-9. To maximize total
surplus, a benevolent social planner would choose which of the
following outcomes?-100 units...
 CHAPTER 23 – ASSIGNMENT #1 Answer the following questions using
the graph shown below. Assume that the firm is producing the number
of units that will maximize their profit in a perfectly competitive
market. You can use the explanatory for problem 23-3 that are in
the Handouts on the main page of your course website to aid you in
the completion of this problem. The D curve in this problem is the
same as the MR curve. ? • How...
CHAPTER 23 – ASSIGNMENT #1 Answer the following questions using
the graph shown below. Assume that the firm is producing the number
of units that will maximize their profit in a perfectly competitive
market. You can use the explanatory for problem 23-3 that are in
the Handouts on the main page of your course website to aid you in
the completion of this problem. The D curve in this problem is the
same as the MR curve. ? • How...
 Question 4-(Chapter 6)- Government Policies: Using the graph shown, answer the following questions: a. What was the equilibrium price in this market before the tax? b. What is the amount of the tax? c. How much of the tax will the buyers pay? d. How much of the tax wil the sellers pay? e. How much will the buyer pay for the product after the tax is imposed? f. How much will the seller receive after the tax is imposed?...
Most questions answered within 3 hours.
-
Where is the error in this code sequence?
String s1 = "Hello";
String s2 = "ello";...
asked 10 months ago -
Financial data for Joel de Paris, Inc., for last year
follow:
Joel de Paris, Inc.
Balance...
asked 10 months ago -
Consider this reaction:
Al2(SO4)3 (aq)+ BaCl3
(aq) Al2Cl6 (aq)- +
3BaSO4(s) . What is the...
asked 10 months ago -
Suppose that Savneet is considering increasing her
recent random sample from 20 car rentals to 40...
asked 10 months ago -
Trucks arrive at an unloading terminal at an average rate of 120
per hour.
Trucks arrive...
asked 10 months ago -
Why are methanol and ethanol completely soluble in water while
octanol is not very little soluble....
asked 10 months ago -
A facilities manager at a university reads in a research report
that the mean amount of...
asked 10 months ago -
When the CuSO4 is rehydrated by adding water to the anhydrous
compound, is this an endothermic...
asked 10 months ago -
A ray of sunlight is passing from diamond into crown glass; the
angle of incidence is...
asked 10 months ago -
A block of mass 0.249 kg is placed on top of a light, vertical
spring of...
asked 10 months ago -
how do the kidneys compensate in the presences of acidosis
a) trigger hyperventilate
b) reserve acid...
asked 10 months ago -
Question 501 pts
The rental rate of capital to the firm increases. Which of the
following...
asked 10 months ago